"He that can have patience can have what he will." -Benjamin Franklin
If there is any one thing that most everyone needs to understand better about statistics is that statistics is 99% logic and forming interpretations, and 1% computation. Sure, the computation must be performed correctly, but that's just algorithmic arithmetic—even then, it's mostly about the setup of the algorithmic arithmetic, which comes back to logic and forming interpretations. This is why some of my articles will never be quick, easy reads—I don't intend to throw out some quick numbers or a quick graph. My goal is educational because anyone who doesn't work on understanding statistics is at risk of being manipulated by them. Never before have we faced so much manipulation through statistics. The people who are supposed to make numbers clear and easy signposts seem busy doing the opposite.
An Unfortunate, Frustrating Meeting
Last year, I had a frustrating experience that I've had the time to think through since. I wanted to think it through carefully and thoroughly before sharing.
I was asked by somebody I admire to talk with some researchers and a lawyer who works for an organization whose mission I greatly respect. These are all good people working to do good things, though I'm not going to name the organization or anyone I spoke with for the purpose of this article. While I am slammed with scores of analyses and projects to a point that I will never catch up with (even if I stop writing or sleeping), I wanted to engage in this case due to the large impact of the organization involved. I considered the time spent a first investment in worthwhile pro bono work that I may do off and on, where possible.
Before I met any of the people involved in the data analysis (for one or more lawsuits?), I was sent a spreadsheet performing a signal analysis that is very similar to the Proportional Reporting Ratio (PRR) that I wrote about here, here, and here. I checked the basic computations, asked about one difference from my own calculations, and continued the conversation. I was invited into a brief zoom meeting with several people involved and agreed to read some research papers related to an illness that might be (probably is, IMHO) related to a particular vaccine (not the COVID-19 vaccines).
Having heard what the researchers were doing, I felt they needed substantial help understanding what would be needed to formulate good evidence for a court case. They seemed to think that a safety signal was evidence, whereas I think of safety signals as pointers as to where to look for evidence of harm. But due to the illnesses among the plaintiffs, the researchers already knew where to look, so the safety signals added nothing to the process or evidence pool. What we really needed, in this case, was to research background rates of illness and prevalence of illness post-vaccination, or find some convincing proxies for those metrics.
I carved out about eight hours to read the papers I was given, and I skimmed some of the citations. I felt that the best use of the second meeting would be to walk through the primary paper I was asked to read, explain the value of the pieces of data in the paper, and then explain what other forms of data we might track down to formulate a complete argument. I laid out my thoughts on a legal pad that I could pull out for the second meeting.
The second meeting came around a week after the first, and while I was presenting my thoughts, the lawyer had a sudden and shocking meltdown, which ended the collaboration. It all happened so fast that I couldn't figure out what the problem was. He told me that I was not talking about the primary paper that I had been asked to read, which confused me. He referred to the paper that he wanted for me to analyze using a label I didn't understand ("the X paper"; not the author or the title, I think), so I thought maybe he was right and I felt bad about it—particularly given how upset he was.
He also told me that I was covering the wrong illness (I'll come back to that). If I recall correctly, he barked that he just wanted for me to say whether the safety signal analysis had been performed correctly, which I took to mean that he felt it was "evidence", at which point I felt pressured to do or say something that was to me unethical (though I suspect he simply had no idea of that folly). With him in a strangely infuriated state, there was not going to be any simple way to untangle all that in the 0.194 seconds of slack between the meltdown and the end of the conversation.
I asked to be sent the primary paper I was supposed to have analyzed, and the meeting ended uncomfortably. A few minutes later, the paper I opened in my email was the exact paper I was presenting about.
The paper covered two illnesses, which I'll call Illness A and Illness B. I was covering Illness A first in order to build a model of what needs to be done to create good evidence (what data was needed, such as past rates of illness and quality life years lost). Then I was going to cover Illness B, but that would have been quicker having laid out the model. And I believe that I framed the conversation that way, though after the meltdown I was somewhat shocked and simply decided to go for a walk. From what I can tell, the lawyer wasn't familiar enough with the paper to know what it said about Illness A because his clients had Illness B. I think that he also likely doesn't have a good idea as to what would qualify as convincing evidence. I'm surprised that the researchers did not chime in to defray the situation, but I don't think they had a particularly strong understanding, either because they seemed to think that running a signal analysis was a meaningful step in the problem formation and solution process.
I did exchange emails with one of the researchers who seemed to understand my frustration after I told her that the paper she sent me was the one I was talking about in the meeting. I wasn't sure what I could do. Giving up ten hours is something I can do some weeks, but I felt like there was a heavy barrier to break through. I would likely have to spend 50 to 100 hours performing an entirely complete research and analysis project, lay it out on slides, deliver it carefully, and then hope that the lawyer would be patient, humble, and diligent enough to work to break free of false impressions of statistics and learn what was necessary to formulate a correct argument based on statistical data.
But the odds are that I'm simply on his shit list, and the stress of the insanity of the DMED propaganda is far more than I would have wanted to absorb during any given year. That's a shame. I think the "medical coercion resistance" movement is hampered by poor communication and a lack of quality statisticians resulting in an extreme bottleneck. I would like to help untenable what I currently see as terrible "data arguments" about fertility rates, cancer rates (I'm closer to Jeffrey Morris's point-of-view, despite my many disagreements with him, than the hype numbers "300% increase in cancer! 5700 increase in stillbirths!", though I worry a great deal about fertility and about soft tissue cancers and recurrence of cancers otherwise in remission), variants (particularly Omicron, which was almost certainly NOT a natural mutation), and ADE/Original Antigenic Sin (which I view as largely a red herring and distraction).
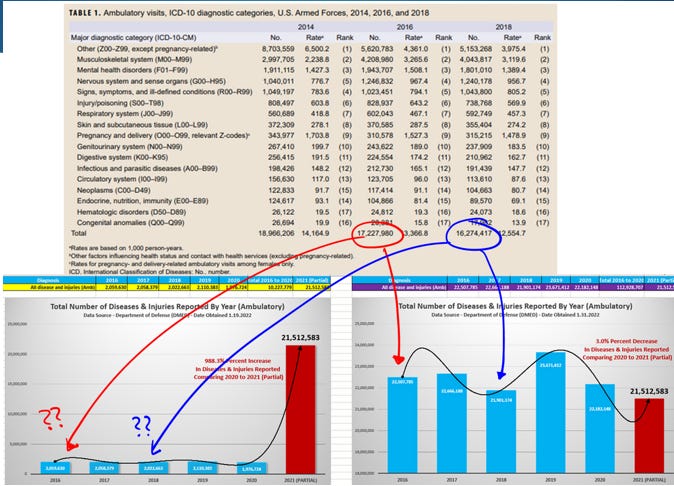
I'd love to have that 1,000+ hours of DMED work back (at least a third of which is fighting propaganda) by myself and my team. Almost nobody with a serious media presence is willing to state the obvious, which is that Renz was terribly and clearly wrong, and to get to the bottom of the DoD's shenanigans, we need to FOIA the DoD and investigate their database contractor in order to understand the exact nature of the disappearing and reappearing data, and anomalies therein.
Safety Signals as Part of a Bigger Picture
Forgive me for holding off on defining a safety signal. Fast forward to the next section and come back if you like. But I'm assuming that RTE readers are familiar with my articles on safety signal analysis (or can become familiar) that is mostly summarized in The Vaccine Wars (originally part of the Chloroquine Wars articles).
The purpose of this section is to discuss what safety signals can do for us in the context of pharmacovigilance, and demonstrating danger or harms due to pharmaceutical (or other) products.
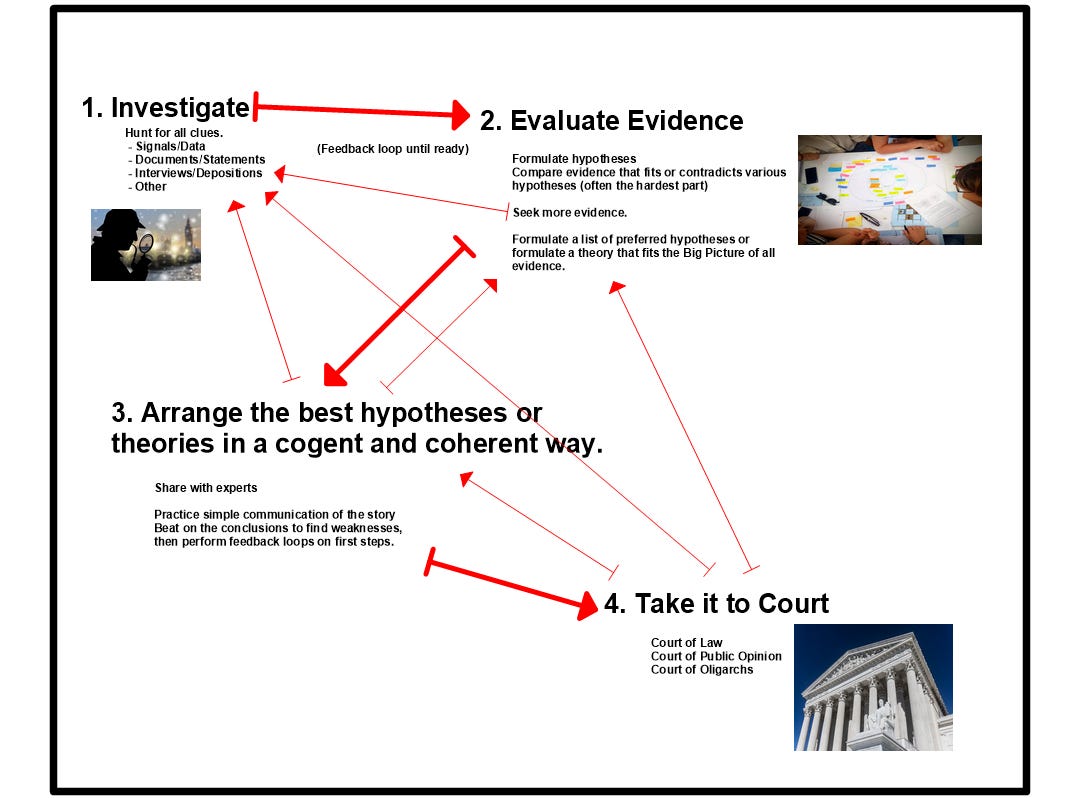
Let us think of the Bigger Picture as an investigative process. I made a brief (and certainly highly incomplete) graphic for the purpose of sharing my thoughts on how safety signals fit in.
The little arrows are simply the observation that every part of the process is part of feedback loops. This is the scientific process, with legal and political implications added.
Think of safety signals like clues that are themselves only helpful as pointers to where to look for more solid evidence. But understand that,
Safety signals are NOT themselves evidence of anything in particular.
Understand that the data that generates safety signals might still be evidence, or be used to generate evidence. The circumstances around them (such as the CDC refusing to follow their own outlined procedures in making use of VAERS or DMED data to conduct proper investigations into COVID-19 vaccine harms) are (more or less to any observer) evidence [of something]. But the signals are not evidence of anything.
A safety signal might flash to say,
"Look here to be more likely to find evidence,"
but that doesn't even mean that there is meaningful evidence to find. The signal simply improves the time economics of locating evidence.
In the case of a PRR signal, it might stand out for a single condition, C, simply because other conditions are suppressed relative to other therapeutics—and even then, only relative to reporting rates, which is itself something to consider (the primary point I was building toward in the meeting that blew up). There may be further Bayesian (conditional) obstacles in determining whether or not the signal is meaningful, but that can only be determined by further investigation.
As such, the safety signals are where you look before you have evidence, in order to cut down on the economically intense process of examining all possible evidence.
The signals themselves just tell us where we are more likely to find actual evidence. That's not at all unimportant at the outset of an investigation. We might liken a safety signal to a rising heart rate on a polygraph test. The reason such a polygraph [signal] test is not admissible in court is because substantial evaluation of results has historically shown that the results are little better than a coin flip. Somebody taking a polygraph test might simply become nervous because of their opinions about, or history with some person, place, or thing subject to the line of questioning. This alone might help an investigator identify paths for investigation for evidence, but the polygraph (the signal test) is not that evidence. The output of a polygraph is just signals, which might mean different things. This may guide an investigator in some cases, but not in others.
I lay this out because part of the breaking of communication between myself and the lawyer was that he stated firmly and demandingly that he just wanted for me to tell him whether or not the safety signal analysis was performed correctly. That demonstrated to me that he did not understand that the safety signals are not evidence (or weak tertiary evidence as support), and so I felt that a statement about whether they were performed correctly would misguide him or jurors in a way that felt unethical if entered into court as evidence, without further processing and refining. I wouldn't want to guide in that direction both for ethical reasons and also because I worry that the misunderstanding might lead to court presentation without the better investigation and evidence needed to make a convincing argument.
This next part is going to seem weird to some people…but I'll explain it better in the next section.
Whether a safety signal analysis is performed correctly or incorrectly, unless there is further evidence to connect the numerical results to actual harm, either analysis (correctly computed or incorrectly computed) could be a better or worse signal. So, my saying that such an analysis was performed correctly is essentially meaningless.
As I said, I'm sure that sounds strange to some people. I will explain in more detail, and I doubt very many statisticians/mathematicians—particularly those with data signal experience—will offer up much disagreement (but I am happy to have the discussion in any case). The PRR analysis has a barely positive correlation to actual evidence of raised rates of illness, historically speaking. And there are many ways for me to slightly alter the function on which PRR is based to get slightly better or slightly worse signals, though it would take a lot of weeks of work to demonstrate that—not time well spent in a highly bottlenecked data analysis environment.
In an email exchange with the researcher who sent me the paper I started walking through in the meeting, I described the safety signal analysis as something like "tertiary, at best," but I now regret saying even that because in fact my opinion as such rests not on the signals themselves, but on the evidence from several scientific papers that I read in the process. I may explain this more later in this article.
What Defines a "Safety Signal"?
This is going to surprise some people—perhaps almost everyone reading. And if what I write here seems weird, talk it over with your most superior PhD math buddy—preferably without context so that you can get a solid answer [during this weird moment in history]. Hopefully most readers will have a sense of where I'm coming from by the end.
First, a safety signal is a signal. That's not merely pedantic, and that much will be made clear.
What is a signal, then?
A signal in this context is any mathematical function that generates outputs from inputs.
That seems overly broad.
It's not. It's the correct starting point.
I'm not saying that I would want to work with any ole function as a signal. There is an economic art to choosing those that best fit a particular task. You want to pick a function that narrows "one-in-a-billion" investigative leads down to something manageable like "one-in-ten" or "one-in-N" for some reasonable N. A good signal is a good filtration process—and perhaps independent from other filtration processes already in use.
During my last job in corporate finance (20 years ago) before partnering with a friend to build an educational technology company, I worked during my spare time developing "artificial intelligence" algorithms—both for high frequency trading and also for longer-(well…medium in the grand scheme)term securities pricing analysis. At the outset of my work, I hadn't thought too much about which variables and functions would be most helpful for the purpose of making a computer babble out signals that I could trade on. I assumed that I could figure that out as I went. I'm a gamer in that sense—I don't learn much in a classroom without an environment to explore. Give me the environment, and now it's play time (where I learn much faster).
There are all manner of financial data feeds that include prices, interest rates, dividends, and pre-built functions like "price-to-earnings ratio"---the latter of which likely already serves to confuse more than help most investors. Each one of these variables or functions is a signal. Each signal correlates with price or some other variable/functional outcome you might want to correlate it with. Every one of them.
If you ever find a pair of data series with zero correlation, it is nearly certain that one is based on the other with some form of randomness (like a random number generator) attached that would "shuffle away" the relationship to appear as Brownian noise. Even seemingly completely independent variables have chance non-zero correlations (which usually fade over sufficiently long time spans). Otherwise, you might as well think as follows:
Any two functions based on data from the same universe are signals for one another.
Election results correlate with stock prices.
The number of models working in Manhattan correlates with grain yields.
Weather patterns correlated with investment in natural gas.
The divorce rate in Maine correlates with per capita consumption of margarine.
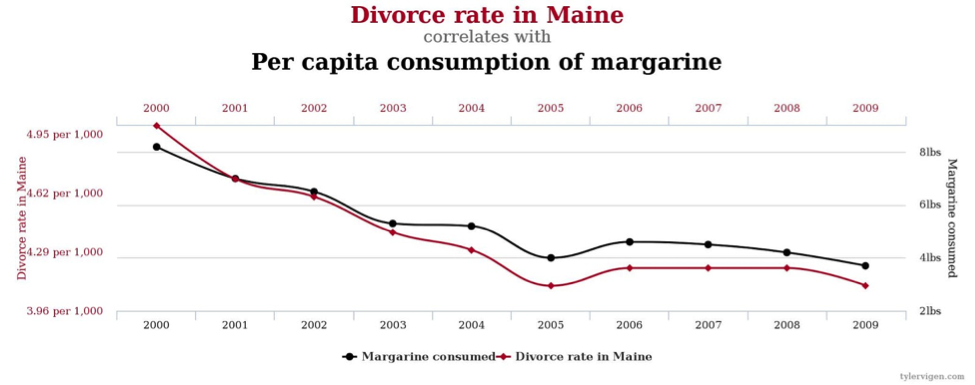
Some of these are sometimes deemed "false correlations", but such a phrase is itself artificial. Each of two series may have significant relationships to a hidden variable (co-variate to both data series analyzed) or function, and the correlations are real, even if a broader view of trends may establish that they are less significant than they appear. After all, given billions of potential variables, there will be many pairs of data series that correlate highly over a short time span purely by random chance. This is much the same as the observation that 1 in 20 entirely meaningless scientific experiments ("Do people who wear red shirts get cancer more often than people who wear blue shirts?") achieve statistical significance (for whatever that is worth in the eye of the beholder—my opinion/interpretation varies by case).
What I found while trying to write the perfect (oh, what a silly goal) trading signal system is that every variable, or function created from several variables, seemed to generate actionable signals (in theory…some signals cannot be acted on given the constraints of a system, like trading fees or the "slippage" of moving the market by the act of trading).
Even worse, those signal variables and functions had their own correlations—they were not at all independent. Given just a few of them, my computer had enough power to perform the linear algebraic bash necessary to unwind the independence of the signals. But the goal is to go beyond what other quants can do simply and easily. Once you have dozens of variables and functions (signals) involved, the computational power necessary to make them useful gets intense. You have to simplify (much more so 20 years ago than now) things to keep the computer running smoothly. Ultimately, I grouped variables in ways that I felt made sense, and averaged scores over several signals. Even then, it was an art as much as a science.
Today, machine learning experts assign weights to variables and functions, then optimize those weights over time. That was my next goal before I got swept away with helping build an online education company. However, a couple of years later I found out that my Frankensignal system was not unlike what the professionals were using. My friend who went by "Simon Funk" was one of the top participants in the Million Dollar Netflix Algorithm Prize, which was won by several groups combining their codes into a Frankensignal system.
The actual work of winning the Netflix Prize wasn't sexy. If you knew nothing about computers, you weren't going to download the data set and discover you're actually Matt Damon in Good Will Hunting but for recommender algorithms.
Even contestants like Mackey, who would go on to earn a Phd in Computer Science from UC Berkeley, or Volinsky, who had the support of his AT&T colleagues, had to spend hours learning about topics like "machine learning," a highly specialized subfield of computer science. They'd then adapt their insights to the figures provided by Netflix. "In the first few months we managed to do better than some of the baselines," explains Mackey. "That was when we really got excited. We were like, 'Wow, we can beat these very simple baselines after all. Maybe we have a chance of doing something in the challenge.'"
…
By most accounts, the earliest days of the Netflix Prize saw some of the biggest technological leaps. A user who went by the pseudonym "Simon Funk" adapted an approach he'd previously worked on of incremental "singular value decomposition" (SVD), which, when applied to the Netflix Prize data, provided an automated method to finding similarities between the movies users loved or hated. Unlike Volinsky or Lackey, he wasn't affiliated with a university or a research company.
The Frankensignal method for winning the Netflix Prize was publicly predicted by another friend of mine, computer scientist and retired hedge fund manager Mike Korns who would go to A.I. trading algorithm talks at conferences, take notes on the code talks, then add each new method to his own system. Then he would sit back and watch the money roll into his hedge fund.
Back to our regularly scheduled program…
Why aren't the numbers in VAERS safety signals that are also good evidence?
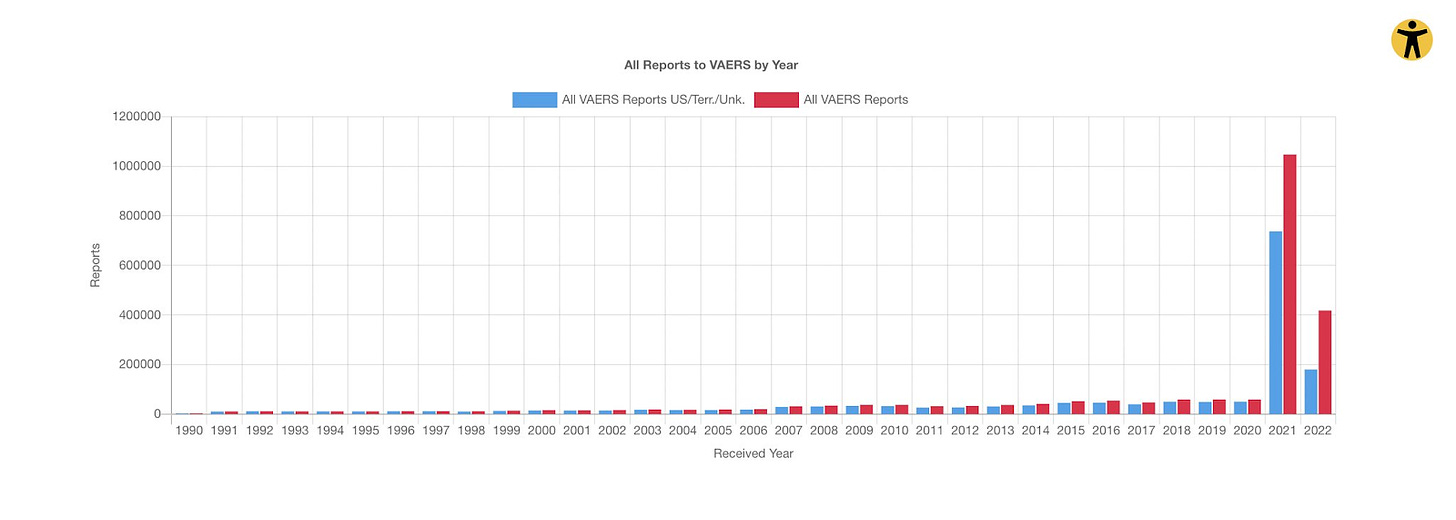
Let's slow down for a moment in order to carefully unwind the malformed intuition behind a question such as this one. Let's take a look at the historical VAERS data.
If you're like me, you see signals of harm in this chart that are apparently associated with the mass rollout of experimental biological products ostensibly meant to fight COVID-19 in 2021. Did that require the use of any automated safety signals? No, but safety signals could have drawn our attention to this chart. We could leap straight to an argument of dramatically increased rates of adverse events. Even then, to formulate a tight argument about the precise nature of this harm, we would do our best to understand potential changes in reporting rates, map these numbers to real rates of illness, subtract background illness rates, correct for demographics curves (non-trivial with an illness like COVID which an exponential risk curve by age), then apply some economic metric (like QALYs) to formulate an overall risk-benefit assessment as a single unit.
In finality, the signal is a key part of an investigative process, but still has a "hit ratio", meaning that it will only sometimes be associated with the outcome we are concerned about.
What do we do about VAERS safety signals?
Well, the real crime was in authorities cutting those safety signals out of the grand feedback loop of investigation (at least publicly), meaning that there is no public investigation.
Meanwhile, we are still traveling through a Clown wormhole with rough tidal forces, and with few spare hands on deck to perform the requisite investigations. And even when we perform them, the lever pullers soaking up attention in the alt-media world ("Hello, is this thing on?"), who may be controlled opposition (whether or not they know it), may ignore those investigations, or even cover them up.
Rounding the Earth is an entirely subscription supported mission. We greatly appreciate your support.

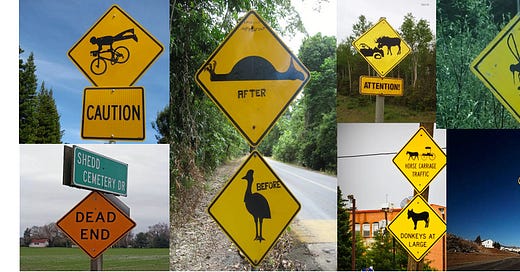


Thanks, Mathew. Though I know little of statistics, I have greater clarity. The signs are too cool, especially the fornicating rabbits.
Awesome. You'll be interested to know that they absolutely chopped the cancer and CJD numbers this past update. This hasn't happened to this degree since the whole thing started and it's really noticeable. I keep an eye on the CJD numbers specifically since, well, you know, brain eating and stuff, and this really is a red flag. Not only is the reduction a red flag because WHY, but the fact that the CDC and FDA are saying nothing about these reports to VAERS is of course, more like the evidence we need for court. Writing a Substack on something else now but will mention on Twitter.