“To be trusted is a greater compliment than being loved.” -George McDonald
From the outset of the pandemic, metrics that represent (sort of) the first derivative of infection waves/curves, have been promoted (by media, politicians, and acolytes of “The Science” more than from real scientists or good faith health experts) seemingly in the best ways to induce anxiety and fear. You may have seen R, R_0 (“R naught”), R_t (“R at time t”), or even R_Z (“localized R”) along with the extra-sciency-sounding enunciations of the subscripts being used by well-practiced public speakers carrying the message,
THIS IS ALL SO BAD THAT WE NEED TO TAKE AWAY YOUR JOBS, YOUR RIGHTS, AND YOUR DIGNITY TO PROTECT THE CHILDREN!
That bad?!
Yeah, so bad that we have to submit to massive experimental interventions too quickly to think about the associated risks (here and here), alternatives, or how harmful this virus would even be in the context of sane public health leadership. So, it’s alright to slow down for the public and maybe also the scientists to understand all this so that informed consent can actually take place, right?
Skepticism of authorities is for stupid right-wingers.
How did viral spread or any of this become about politics?
Is...is Patient Zero laughing?
By KieraCampbell - Own work, CC BY-SA 4.0
R, (Basically)
R is the basic reproduction number---at least until Wikipedia decides to play funny games with it, too. R is sometimes casually called the rate of infection, but has a specific definition: the expected number of cases directly generated by one infected individual (averaged over all possible members of the population). Wikipedia doesn’t include the parenthetical, but the definition isn’t complete without it since the “expected value” aspect of the calculation applies once at each end of the calculation, where applying it only the first time would mean there is a different R for each individual, which misses the entire point of the statistic, which is to help us understand infection growth throughout a whole population. This distinction would not be necessary if populations were homogeneous, but in fact they’re not. And if you’re now thinking this is bound to get complicated, you don’t know the half of it. Wait until science reporters and school boards get a hold of all this. Whoops, too late!
But before we move forward, let’s pour some gasoline on what is already one heck of a public health dumpster fire:
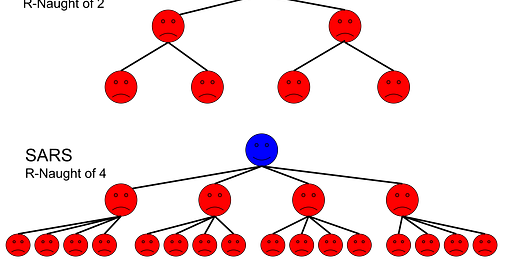
R_0 is R when all members of a population are susceptible. That is to say that R_0 doesn’t change (for a particular population, but we’ll get to that, and even that isn’t true, and we’ll get to that too), but R does. In fact, in the extremely simple diagram above, if any of the people at any level of the infection tree know each other (meaning it’s not really a tree, and why should we expect every graph to be a tree, anyhow?), then the next branching is less numerous by some fraction, which is to say that R constantly shrinks.
R_t (sometimes R_e) is the effective reproduction number, which is the reproduction number at some state (usually a point in time, hence the use of subscript variable t). We will talk about this more after building up some context.
Context is everything.
In order for you to complete your epidemiological training, you must either submit yourself to Marxist public health re-education camps, or open your mind to question what you know and don’t know. For those taking the latter route, the first thing I’d like for you to understand is that there is no R.
I know, this seems frightening to grapple with---particularly for those people who never took a step outside of the public health Matrix. But it’s the truth.
There is a definition of R, and there is an algorithm for computing R as a statistic, certainly. But the definition implicitly assumes unstated contextual variables. The extremal principle can guide us: Would we feel safer from viral transmission in a crowded room, or walking outdoors with a single companion? Do we expect transmission to take place more often and more quickly in a densely populated city during the winter when people spend more time insulated indoors, or in the sparsely populated countryside during the Spring, with everyone’s windows open?
Speaking of which---would you rather be trapped in a closed-in hospital during an aerosolized viral outbreak---or one that lets the outside in? That’s worth thinking about.
The unstated contextual variables might as well be summarized as, “anything and everything that affects the system,” be it number of interactions, time duration, immune states, graph structure of society, the weather, the size of the rooms where interactions take place, and perhaps even whether people are told to sit at home not using medicine at all until viral replication has fully run its course. Yeah, that too! Maybe we categorize that as intention to treat?
So, R and its cousins are statistics describing mythical discrete individuals who are averaged over the system and therefore part of the “continuous” whole. It may be worth going back to reread the definitions above now that we’ve reached this point.
The point is this: there is no one number that is R. Clearly, R changes by context. Even R_0, which is R in a completely susceptible population, is highly dependent on context. A 2019 paper (Delamater et al) published at the CDC concurs:
“More than 20 different R0 values (range 5.4–18) were reported for measles in a variety of study areas and periods (22), and a review in 2017 identified feasible measles R0 values of 3.7–203.3 (23). This wide range highlights the potential variability in the value of R0 for an infectious disease event on the basis of local sociobehavioral and environmental circumstances.”
That’s right---for the same virus, R_0 can be 4 or 200. The only bound is the lower bound at zero, but even that’s debatable since it means we’re no longer talking about an infectious disease. Even worse, R can be higher and lower within subpopulations, where a packed highrise apartment tower or even a household can count as a subpopulation. Or a hospital.
What Good Are These Crazy Statistics, Anyhow?
R and its cousins do have a purpose. Within a context, where we can pretend that R_0 is more or less idealized in a known and stable form, we can model epidemiological waves.
These kinds of models are excellent tools for gauging impacts of epidemics in the right hands---meaning statistically-trained individuals who take them with a grain of salt while recognizing that models are limited to the degree that they correctly describe reality. And in practice, this means that the media can pick whichever result is scariest and tell us all about it day and night without anyone ever knowing that the even more advanced, bleeding edge models are actually old, undocumented garbage code written by an “expert” funded by Pfizer and Moderna investor and vaccine guru Bill Gates, with a long history of doomsday predictions.
Understand yet?
Honestly, in the hands of a good modeler, there are plenty of good uses for R. But the last thing we should do is tell people that “R big, so pandemic bad”, which is untrue on so many levels that it’s going to take another article or to in order to give a complete picture of the problem, though I leave you with a spoiler down at the very end of this one.
The Incorrect Story of Viral Exponentiation
Throughout the pandemic, we’ve heard the word “exponential” thrown around liberally. I had never understood before recently quite how psychopathically weaponized the word could be. I’ve used it thousands of times myself---both in the strictly and correctly defined sense and also in the casual sense. I even wrote a textbook chapter about exponential functions once upon a time.
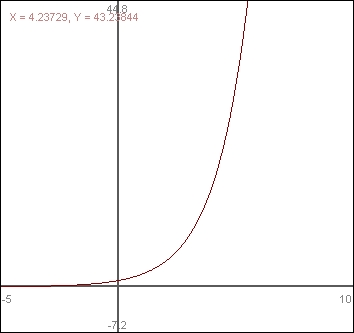
The strict sense (artofproblemsolving.com):
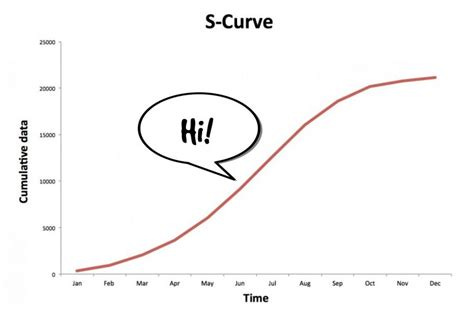
The casual sense (lesswrong.com):
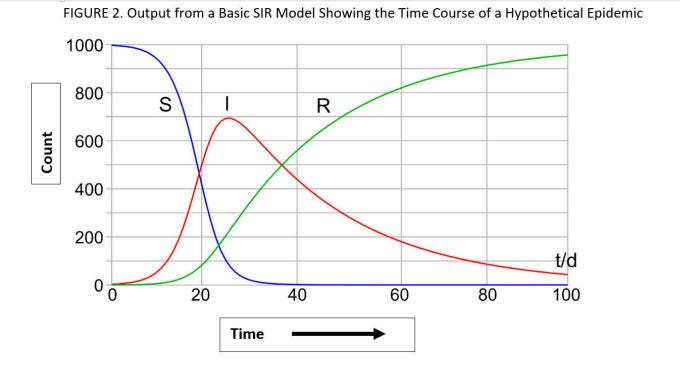
The second example below is not really an exponential function, but starts out like one for what might be called “half a second” in technical math jargon. That’s the casual exponential growth of infection curves (like the green curve in the SIRS model diagram we saw a little while ago). That is to say that it’s not really exponential, and it doesn’t go off to infinity and then fall from the sky like an asteroid killing everyone.
In R-speak, this is where R_t comes in. The growth rate of the infection cases slows continually until the total number of actively infected individuals reverses and heads back again toward zero. This happens as the proportion of the susceptible population shrinks, which in turn shrinks R_t proportionally.
Exponential Fear
Understand that I don’t think fear grows exponentially for very long, either. In fact, I suspect fear can be modeled much like viral infection, except that it’s more easily transmissible over the internet, which is a more well-connected graph. That kind of makes me wonder if a pandemic of fear was the real point of lockdowns and other absurdities during the pandemic.
Here, Eric Fecal-Dingleberry’s tweet storm on January 25, 2020 set the stage for weeks of intense fear porn targeting an unsuspecting public.

While Eric’s Wikipedia page generously describes him as engaging in “coronavirus preparedness advocacy”, it should be understood that he is a nutritionist with no experience in epidemiology of infectious disease, embarked on a campaign to transform himself into a public political figure, and was roundly smacked down by his own peers.
Interestingly, Eric’s “credibility” stems partially from the same VIOXX whistleblowing scandal that Eric Topol (who often flubs basic math, got Surgisphere incredibly wrong, couldn’t recognize the obviously flipped conclusion to a study on SARS-CoV-2 variant emergence that were supposedly right in his wheelhouse, and also turned down an invitation to judge raw ivermectin research data for himself) became famous and powerful for bringing to light. But I like to present a balanced view of every human being and obvious villain, so I’ll mention that Eric Fecal-Dingleberry cares enough about his son to move him to another country so he could continue learning in school [while American students could not].
Eric’s impact and early popularity were undeniable---and very possibly stoked by well placed social media booster accounts. Eric has since deleted the first tweet in the thread, which suggests the possibility that he knows in retrospect how artificial and emotionally manipulative his words appear to serious people. But here are his words, in case you were wondering:
Rrrrrr, You Ready for the Punchline, Mateys?
Geographies where R_0 was the highest fared far better during the pandemic than those where R_0 was moderately low. I will explain why in an upcoming article that will (once again and for the 83rd time) roundly obliterate the absurdities of the measures taken by most of the world’s public health power players. Stay tuned, and remember to send this article out to a few friends who might still need to read this and understand how to begin to dial back their anxiety levels. Your help in restoring sanity is always appreciated.


The pseudoscience behind the politicized strategies to mitigate this pandemic remind me of the pseudoscience of economic theory. When the real world doesn't conform to the textbooks, do we still cling to the mathematics that support neoclassical (or neoliberal) economic theory?
https://www.washingtonpost.com/news/storyline/wp/2015/01/05/the-protesters-who-are-trying-to-upend-the-fantasy-world-of-economics/
I was struck by another Washington Post article headline yesterday: "Booster shots won’t stop the delta variant. Here’s the math to prove it." Their tagline was this: "Vaccinating more people would help more than giving another dose to the vaccinated"
https://www.washingtonpost.com/outlook/coronavirus-vaccine-booster-shots/2021/08/11/aefec5dc-fae0-11eb-9c0e-97e29906a970_story.html
Delving in to R0 and Re mathematics, they explained "The Re helps us estimate how much a disease may spread when a population has at least some immunity."
Never mind that "some immunity" includes all those people who are vaccinated that are increasingly getting breakthrough infections.
The Lancet has had its share of controversies during this pandemic. But this article is a good one to read (except we can all cough when reading "relatively low mutation rate of SARS-CoV-2"): SARS-CoV-2 evolution and vaccines: cause for concern?
https://www.thelancet.com/journals/lanres/article/PIIS2213-2600(21)00075-8/fulltext
"From this overview, only data on influenza might suggest that evolution in SARS-CoV-2 could eventually lead to a less efficacious vaccine. A protective factor is the relatively low mutation rate of SARS-CoV-2, although prolonged infection in immunocompromised hosts might accelerate mutation.5 However, the length of the spike protein used by licensed vaccines is relatively short (∼1270 amino acids), and one preprint paper has indicated that the natural antibody response to infection (and presumably also to a spike protein-based vaccine) is concentrated in just two sections of the protein: the N-terminal domain (NTD) and receptor-binding domain (RBD).6... Another notable finding is that SARS-CoV-2 passaged in the presence of polyclonal antibodies (in the form of convalescent sera) can also mutate and escape neutralisation by the multiple antibodies. In a series of experiments described in a 2020 preprint, SARS-CoV-2 was grown in the presence of neutralising COVID-19 convalescent plasma from a recovered patient.9 After serial passages, three mutations were generated (a deletion and insertion in the NTD loops, and a point substitution in the RBD) that allowed the newly formed variant to become completely resistant to plasma neutralisation... An unresolved question is the effect that the reported mutations might have on T cell immunity, which is known from vaccine trials to be robustly stimulated by the recombinant spike protein. T cell escape has been well described for persisting viruses such as HIV, HBV, and hepatitis C virus.15"
This potential to evade vaccines includes a potential to evade detection. https://www.nature.com/articles/s41587-021-00845-3
With a pivot to "What's causing long COVID?"
https://www.thenakedscientists.com/articles/interviews/whats-causing-long-covid
"What’s the mechanism behind why some people are developing these syndromes? Chris Smith spoke to Yale Immunologist Akiko Iwasaki...
Akiko - So there are a couple of theories that are now posed to explain long COVID. One is a lingering virus or a viral reservoir that persists in a person that can stimulate chronic inflammation. The other possibility is autoimmunity; that even a mild viral infection can trigger autoimmunity, which has long-term consequences."
Both of these hypotheses are concerning. But when the virus lingers and/or evade detection (think immunocompromised hosts in a hospital setting; in a nursing home or in high-density living), we are in big trouble when public health agencies assert that full vaccination is the key to ending this pandemic, and tell us to doff masks and put full faith in rapid tests and vaccine status.
I do think we have to prepare for the failures we had in developing HIV vaccines to control this pandemic, with attention to pre-existing candidate antiviral drugs and existing ones, like ivermectin, unless it too becomes resistant to mutant strains.
I appreciate your work sir. How you manage to do it all baffles me.