"At the moment, he is suffering from delusions of adequacy." -Walter Kerr
Source: The Mentally Ill Hero: How the Tick and Dirk Gently give Unbalanced "Sidekicks" Center Stage
Sometimes it's not quite as funny as an episode of The Tick.


I know that it bugged some readers that I pulled my article about Kyle Sheldrick's attack on Paul Marik's research earlier this week. I'm happy to give a full explanation, and then to repeat the exercise, but with respect to the actual methodology in Marik's paper. Otherwise, I hereby announce that I am 100% okay with my self-plagiarism of my earlier article. I report no ethical concerns or conflicts of interest with respect to my editorial decision. This is the better article. I hope that you enjoy it.
Recall that Kyle Sheldrick is part of the Superfriends team, tickling each other en route to finding flaws in studies of early treatment efficacy despite the successful treatment of hundreds of thousands of patients by doctors such as Brian Tyson, George Fareed, Ben Marble, Didier Raoult, Pierre Kory, Heather Gessling, and so on, with a collective survival rate in the ballpark of 99.97%.
Such numbers from early treatment doctors go far beyond the power-need of RCTs—out beyond the realm where the published literature confirms, "This RCT/OCT distinction clearly doesn't matter anymore."
So, what's all the fuss about this time, Sheldrick?
http://kylesheldrick.blogspot.com/2022/03/evidence-of-fabricated-data-in-vitamin.html
Tonight on twitter a paper allegedly describing a 2017 study by a "Paul Marik" and team at Sentara Norfolk General Hospital describing a large survival benefit from Vitamin C was brought to my attention as a medical research finding that was not replicated in further studies and later reversed. The user stated that to their knowledge no evidence of fraud in the conduct of this study had been identified. The study is found at https://doi.org/10.1016/j.chest.2016.11.036
Unfortunately within about 5 minutes of reading the study it became overwhelmingly clear that it is indeed research fraud and the data is fabricated.
While usually I would use cautious language of "unusual" or "unexpected" patterns in the data and describe "irregularities" and "concern"; no such caution is warranted in this case. This is frankly audacious fraud. I have not requested access to the raw data or contacted the authors for explanation as the case is audacious no other explanation is possible.
Allow me to explain.
You sure, bruh?
This study allegedly describes a before and after study, examining the effect of a new treatment regime based on vitamin c on mortality in sepsis, claiming a roughly ten fold reduction in death. Each cohort had exactly 47 patients and the patients were not matched. We know this not just because matching was not mentioned but because the authors specify that these were two cohorts of "consecutive" patients, precluding patient matching by definition.
For the record, here is the Methods section from the paper in question. Unless there are some details not contained here (those can slip into an appendix or even slip out of a paper), I agree for the moment with Sheldrick's belief that these patients were not matched at random. They simply walked in the door during separate control and treatment periods.
Now, let's get to the part where Sheldrick displays total misunderstanding of statistics. Or is it disunderstanding? I'm still trying out "mistatistics" and "distatistics", though both sort of put me in a blood rage state with respect to the entire field of biopharmaceutical pseudostatistics that desperately needs to be dismantled and reconstituted.
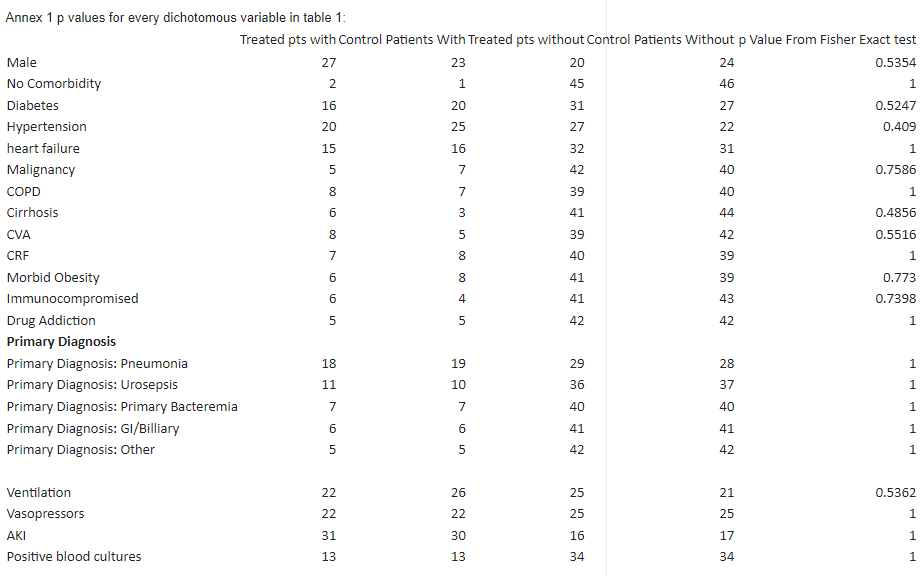
Based on this we would expect that if there was no systemic bias the p values for differences in dichotomous baseline characteristics (gender, demographics, comorbidities, diagnoses etc) would, in most circumstances, centre on 0.5. If systemic differences existed however the groups may be less similar and p values may tend to numbers below 0.5, and this would not be suspicious in a non-randomised study. Systemic biases to p values greater than 0.5 are not usually possible without matching (or some very rare pseudo-block designs not relevant here) except in the setting of fraud.
Unfortunately every single primary diagnosis (Pneumonia, Urosepsis, Primary Bacteremia, GI/Biliary, "Other") is matched perfectly with a p value from a Fisher exact test of 1.
Indeed of the 22 discrete/continuous variables reported in table 1 the majority have a p value of 1.
Let's start with, "we would expect that if there was no systemic bias the p values…would, in most circumstances, centre on 0.5."
How is "most circumstances" defined? This is a casual word, and it's fine to use casual words in math/stats, but not to push non-casual facts or conclusions. This matters because…
The p-values computed by Fisher's test, which he uses…are not centered around 0.5.
In particular, (2) is apparent to anyone who could actually explain how Fisher's test works for discrete variables. Sheldrick just told us, as loudly as he can, that he is not qualified to interpret the results he got from feeding some numbers into a statistical calculator.
To be fair, this is true for nearly all physicians, though I assume that most are humble enough to recognize that, and not to over-interpret beyond capacity. The best decisions about p-values and a lot of other stats are probably reached by getting several smart people on a call and talking through results from different angles and clinical experience, but I digress…
The use of p-values in biomedical statistics is itself a bit controversial. Almost everyone reading and writing research in medical fields interprets p-values differently than Ronald Fisher defined them. They are often taken to be probabilities of something like, "the probability that an event would happen at random," which is itself based on a misunderstanding of distributions of results, models, and context. That's a very long story with no easy write-up, so instead of talking through how wrong that is and why, I'm going to compute some actual probabilities to make a point. From Sheldrick's chart of computations:
I will admit that I was surprised to see quite so many 1's, but I've seen far weirder in ordinary analysis in which the data never left my hands. So, I decided to do what needs to be done under these circumstances—actual calculations other than decontextualized numbers rammed through a statistical rubrik.
Sheldrick Fail 1 - Correlations
Let's start with the obvious. When I look at this list, I see a whole lot of correlated or dependent variables. Even aside from the skew of p-values in the positive direction (for which we are about to see examples), this increases the probability that when one variable is balanced (by chance) that others are balanced as well. Sheldrick seems to think this won't have a substantial effect on his probability calculation, but having built an artificial intelligence system that crunched dozens of variables for the purpose of stock trading, I can guarantee that he is very wrong (I may come back and edit this section if I get ahold of something like a correlation matrix for either the real data, or find a pre-written source on the internet with plausibly similar data). Computing p-values without respect to these correlations is wholly inappropriate, and not particularly meaningful. The results can be off by orders of magnitude. Sheldrick's casual dismissal of this hurdle is frightening. I'm frightened for him and the legal fees he may suffer.
Sheldrick Fail 2 - Malignancy
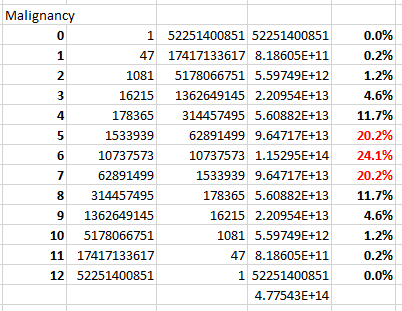
Let's start with the example of Malignancy, chosen as fitting of the efforts of Sheldrick and his Superfriends. The p-value for Malignancy is "high" (I guess), but not quite 1. We consider the case in which 12 of the 94 patients meet the criteria for malignancy, then compute the number of ways to paint 5 uncolored balls red in the first urn of 47 balls, and 7 uncolored balls red in the second urn of 47 balls as,
We can do this in a spreadsheet for each of n = 0, 1, 2,...,12, then examine the proportions of the results:
Note that a (6,6) split would have a p-value of 1 a whopping 24.1% of the time. And 64.5% of the time we get splits of (5,7), (6,6), or (7,5). In these cases, we get p-values of .7586, 1, and .7586.
Yes, he really did list that p-value of .7586 out to four decimal places. Posing like a boss. But when nearly two-thirds of p-values exceed 0.75, the fact that the p-value is "[suspiciously] high" ceases to be particularly meaningful, and certainly doesn't represent anything rare. For the record, the expected p-value for this case is 0.6429, not 0.5. I leave that for statisticians in the audience to check.
Sheldrick's take:
A "quick and dirty" way to assess this would be to consider that the probability of any one variable having a p value over 0.4 is 60%, the binomial probability of 22 such measures having no observed values under 0.4 is close to (0.6)^22 or around 1 in 100,000, this assumes independence which is perhaps a little unfair, but likely underestimates the improbability of such a finding as the results are not evenly distributed between 0.4 and 1.
He's handling discrete probabilities for small N as if N were very large, or as if the variables were continuous (which is to say that he has no idea why that's important). By his logic, he would tell us that the probability that a p-value is over .75 is 25%. Yet, we just examined a case in which it was 64.5%! Similar adjustments over 22 variables could stack up to orders of magnitude in outcome. Then he goes on to suggest that the assumption of independence "underestimates the improbability of such a finding," which shows that he lacks the discipline (probably capability) to check a single simple example to discover that he's backward on that point.
Who's the fraud, now?
Sheldrick Fail 3 - Primary Diagnosis: Dumbass
How rare is this?
Sheldrick doesn't ask. Maybe he thinks his previously quoted computations have a lot to do with these results (they don't). He just…acts as if it's a reason to scream fraud (it's not).
Before I get started with computations here, I want to point out that there are 1,793,220 distinguishable ways to paint the 94 balls evenly split into two urns each one of 5 colors with numeracy (ordered) (37, 21, 14, 12, 10) as in the example above. I'll come back to why that's important.
A few calculations:
The probability of a (5,5) split when painting 10 balls at random out of the 47 in each of two urns red is 26.0%.
The probability of a (6,6) split when painting 12 balls at random out of the (remaining) 42 in each of two urns orange is 24.4%.
The probability of a (7,7) split when painting 14 balls at random out of the (remaining) 36 in each of two urns green is 23.3%.
The probability of a (11,10) split when painting 21 balls at random out of the (remaining) 29 in each of two urns blue is 20.7%.
Since all the balls get painted, we paint the remaining balls yellow (the color of cowards) with probability 100%.
Multiplying these probabilities together, we find that the probability of getting exactly the split in the Marik paper is 0.31%. And the probability of getting p-values of all 1's is 1.2%.
That's uncommon! Maybe Sheldrick has a point?
Um, no. Recall that there are 1,793,220 ways to paint the balls. This one particular way (ordered 5-tuple) in the Marik trial happens once in 326 attempts (rounded). There is in fact no other single distribution with greater probability, so why should we expect some other one? The chances of getting p-values of all 1's is 1 in 82 (rounded). Are we really suggesting that we compare all 1,793,216 rarer distributions against the 4 that turn out to be most probable as a way of declaring shenanigans?!
But let's be a little more fair than that. If we define "suspiciously balanced arms" as "all 10 numbers in the 5 splits within 1.5 of their pairwise mean (without changing the totals)," we find that this occurs between 1 in 5 times and 1 in 6 times. That's not particularly unusual at all.
There is an intuitive mechanism at play, and that is the fact that when each color paints balls in a balanced way, the next color becomes more likely to result in balance between the arms. That's the power of dependence (or a conditional—however you might want to think of it).
On top of all this, our not particularly uncommon result of "suspiciously balanced arms" surely correlates (because…we're talking about prognosis) with all of the other variables Sheldrick seems worried about, which is to say that each of them is now more likely to show a high p-value.
Well, maybe arrogant dumbasses who barf pseudo-statistical claims across medical partisan lines (why is that even a thing?) can change, too?
Sheldrick Fail 4 - Practicality
Imagine for a moment that instead of the relatively balanced splits achieved in the Marik study were instead skewed in a way that loaded up one arm with risk. Similarly to what we've seen above, any particularly unbalanced result (unless we stack several-thousand n-tuples of stats to 1) is far less likely than one that is well balanced. The statistician(s) on the paper could still perform the exact same adjustment based on propensity scoring as took place. In other words, the result was not based on the presence of balanced arms.
Why would anyone fake a nonessential aspect of a paper like this?
Not only that, but in the event of extremely skewed arms, the authors could have run the treatment group against a second control arm selected on a different date range. Calculations could have been run for both, but at least one of the two control arms would likely have had somewhat similar stats to the treatment group.
Even when such an option is at play, whether or not the authors think about it (who would unless the differences were extreme enough to worry about any adjustment for comparison), we can think of any published result as having passed a conditional test, which increases the likelihood that a published result includes a higher-than-average number of "suspiciously-high-but-not-really" p-values.
Sheldrick, you didn't get that fancy hat for doing statistics.
Sheldrick Fail 5 - Cherry Picking
Sheldrick's accusation is not based on the improbability of the p-values of all the variables in the Marik study. It's based on his chosen subset of the variables with "extreme" p-values (even though many of them are clearly not extreme).
Why is this dumb?
Sheldrick computes 16 p-values greater than 0.56, then declares that he's holding the nuts. The problem is that his hand isn't real.
Suppose that there are 100 variables in a study. We'll make the extraordinary and laughable assumption that they're entirely independent. We'll even magically warp the variables into continuous form just to help ole Sheldrick out. We'll assume a uniform distribution of p-values on [0,1]. And after all that, we note that there are 10 p-values greater than 0.9.
"By God, it's gotta be fake!"
Well, hold on there, pardner. With 100 variables, we should expect that 10 of them have p-values greater than 0.9.
If there were only 10 variables, it would be quite rare indeed to find (all) 10 of them to have p-values greater than 0.9. On the other hand, with 1,000 variables, that prospect would be all but guaranteed. The point I'm making is that the number of "suspiciously high p-values" is not enough information to even begin to model a probability outside of the context of all the other variables. And Sheldrick's sad attempt at envelope math took place without respect to all the other variables and their p-values.
I'll give him four points for using "dichotomous" in a sentence. But he still gets a failing grade.
Sheldrick Fail 6 - Lack of Consideration for Rates of Illness
To this point, I've entertained the notion that computing a p-value as if we're talking about random distributions of balls in urns is a reasonable model. But there are infinitely many models from which we can compute a p-value. Sheldrick carves out a vague notion of improbability based on exactly one of those. Is it the most reasonable one?
How often do you look at a graph of common illnesses and see massively lopsided totals between one half year and another?
I don't see that very often. In fact, I can't really think of a particular instance when I've seen a chart where diabetics, smokers with COPD, or drug users suffered hospitalizations twice as often during the first six months of the year than the last six months, or vice versa. In other words, we should expect distributions for many of these variables to compress toward a balance, thus resulting in high-ish p-values [when inappropriately computed on the wrong distribution].
Starting with common sense is the best way to test assumptions. And a neutral observer's first instinct (assuming they have practical experience with real world statistics) is to look at a handful of high p-values (if they are indeed higher than expected in frequency) and ask if the distribution is correct. In fact, that was the real purpose of Fisher's p-values to begin with. The very goal of a p-value is not to compute a one-off probability [of whatever], but to adjust the assumption of the distribution until the computed p-values appeared entirely random. If Sheldrick weren't such a douchenozzle, I'd forgive him on account of the biomedical field's generally inappropriate use of and computation of p-values.
But in his case, I'm sort of mesmerized. I can't decide if this is funny or just sad.
In Conclusion
It does not appear that Kyle's statement of fraud based on a few p-values is enough to call shenanigans in such a public and legally risky way.
Sorry, Kyle. You were so close. Like, soooo close. See, look:
But I'd like to re-invite Sheldrick (who turned down my last offer) to a recorded video chat about statistics. This time is different—different topic and different stakes. We'll make it light and relaxing. Or we could skip the talk of pandemic-related medicine and just play some hands of Omaha. I bet that would be more fun, anyhow.









"If Sheldrick weren't such a douchenozzle"
Always appreciate the use of technically accurate terminology!
Universal Mathematical functions will be (re)defined by the ministry of truth To generate a better collective understanding.😜