The Challenge of Quantifying the Healthy User Bias
Shattering the Efficacy Illusion, Part 2
Articles from the Vaccine Wars can be found here.
After working zero serious hours for three days (wow, that was nice), I’m back in the saddly to finish this series off. It maybe a five-parter, but we’ll see. In this article, we continue through an education of the primary illusion—at least with respect to the U.S. data.
Strap in. We're going to jump through a few hoops to justify the punchline. Maybe more than a few. Just remember that I'm right here with you for the whole ride. I'm holding your hand. We're holding hands now. It's beautiful. And healthy, which makes people live longer. And there is more beauty to come. But first, I've prepared a fictionalized account of a trip to the doctor's office in order to explain something very important.
A Man Walks Into a Bar…
"His alcoholism is tearing his family apart. The bartender tells him, 'I'd have only charged you $200.'"
The bartender asks to see his vaccine passport.
[Three Days Earlier…]
A man walks into some doctor's office to get a pill, to satisfy his wife's anxiety over not seeing the doctor often enough, to get a fake vaccine card, to get a medical marijuana card, or for some other reason. The doc pulls out a clipboard, asks the man some basic questions, like whether the man has insurance, likes the office decor, or owns a gun (because of course allopathic medicine is now concerned with gun control).
The doc gets to the point, "Quantify your health for me."
"Uh…wait, what do you mean?" the confuzzled man asks.
After a couple of minutes, the man slips $300 into the doctor's coat pocket and walks out with a very official vaccine card.
That fictional exchange demonstrates an important point: it is weirdly difficult to pin down where any individual is on something like an aggregate health distribution, or how much that would bias a given observational study.
Fortunately, we present some practical hacks that help get us there. Before we move forward, let us provide some more simple definitions:
The wealthy user bias (WUB) is the effect on the statistical outcomes of a medical product based on the user group being a healthier cohort than the non-users.
The educated user bias (EUB) is the effect on the statistical outcomes of a medical product based on the user group being a more educated cohort than the non-users.
The HUB, the WUB, and the less-easily-pronounced EUB are virtually one in the same. After all, what else would the wealthy want to purchase than [anything that leads to] more (and healthier) life? What begets achieving orbit from living paycheck-to-paycheck to accumulate wealth more than health? What begets wealth more than education?
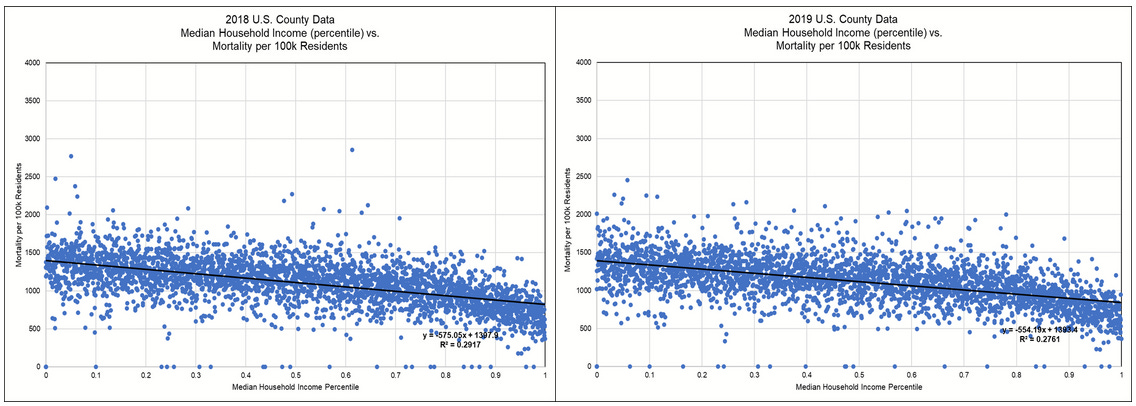
While I'm glad we're on the same page, it behooves me to demonstrate the point. One good indication of the health of a county is its mortality rate, and we get that from pre-pandemic (2019) data.
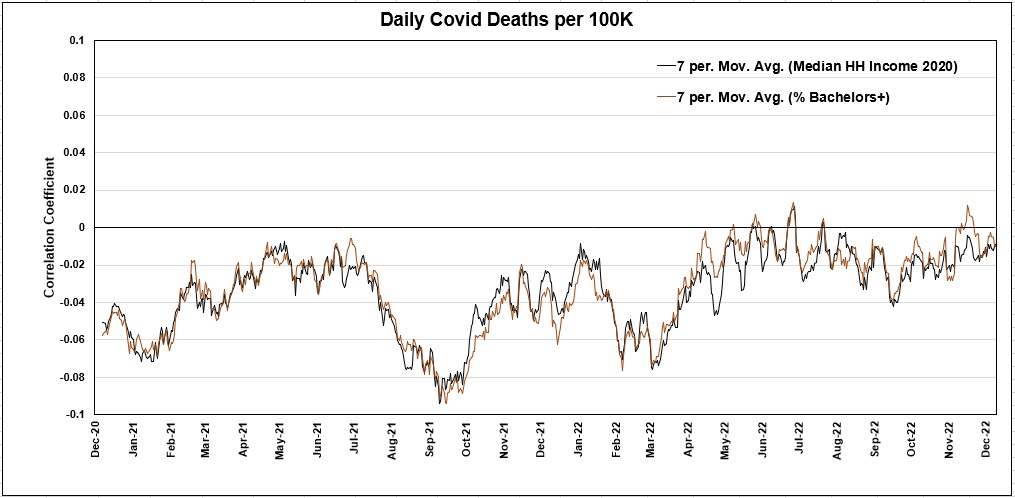
Note that in the data set I'm using, from December 13, 2020 to May 12, 2022, the correlation between median household income and % of the residents of a county with a bachelor's degree is 0.71. That's extremely high considering divergent factors such as people with college degrees in nursing homes, or exactly how impoverished the people below the median income might be—is there a homeless shelter in this zip code? Clearly wealth and health are highly related, thus WUB and EUB are highly related.
To test my hypothesis that WUB and HUB are highly similar, I worked up several scatter plots relating median household income by county to all-cause mortality for each of the over 3,100 U.S. Counties.
These scatter plots from 2018 and 2019 (pre-plandemonium) show that greater household income is associated with around a 40% county-level mortality rate reduction (maximum to minimum). And clustering around the trend lines is tight.
During the pandemic era, the wealth advantage is slightly larger than during the immediately preceding years. Within the pandemic era, it grew during 2021, but retreated substantially in the partial data set of 2022 (which includes data through June 7, so I projected it linearly to a full year). The least wealthy counties suffered significantly worse excess deaths during the plandemonium. However, in 2022, mortality in the wealthy counties was still growing (at least through May 12), while the mortality in the least wealthy counties had finally begun to revert (hopefully a continued trend).
The WUB and the HUB are also essentially the same as the EUB. Just as we saw the WUB almost perfectly track the mild correlation signal of VE, the EUB does the same.
Now that we've established the basic fact that HUB = WUB = EUB, I will proceed with referring to any of the three of them as the HUB moving forward. This simplifies the topic matter in an ordinary and useful way. There is no sleight of hand—we only make this substitution available because the HUB is itself the hardest to quantify.
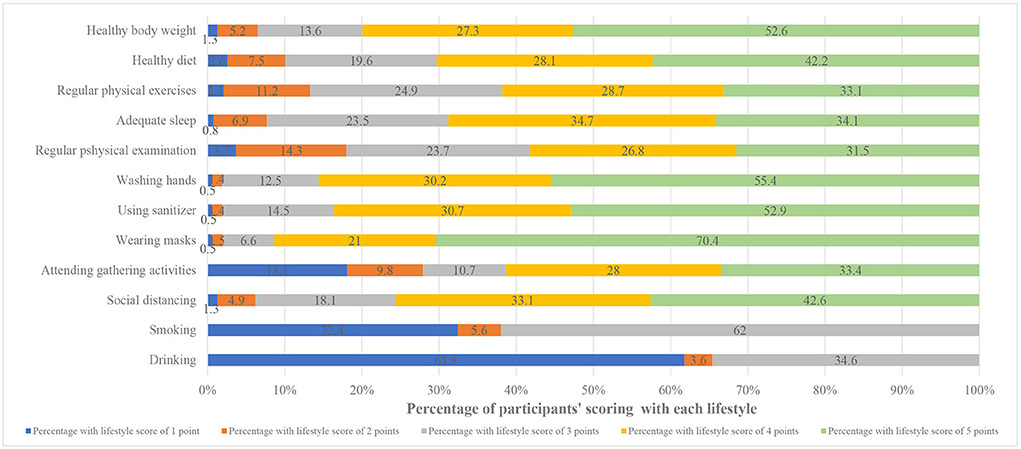
Understand that though the HUB is hard to quantify, there is at least a bit of research out of China (Miao et al, 2022) in which authors used lifestyle scores finding that higher lifestyle scores correlated heavily with positive perceptions of COVID-19 vaccines, with other variables making very little difference.
The lifestyle scores are good enough that other variables do not much cut into or around the overall result. This relationship is good enough that I at least wonder why such a simple step is not standard procedure for vaccination studies! You know what would be more cost effective than printing $13 trillion (I'm including the $4.5T in loans to three behemoth banks—sorry, not sorry) to handle a pandemic?
"Fill out this survey for a chance to win $10,000."
After. Every. Vaccination. Heck, throw in a Krispy Kreme donut.
One of the more significant observations we might make is that alcoholics (and presumably drug addicts) are among the least likely people to want to get vaccinated. This seems downright obvious when you stop to think about it. I'll come back to this point later in the article series.
Now that we've clarified what the HUB is, doesn't it seem like an obvious consideration to take into account while observing data related to something like a mass experimental quasi-vaccination campaign with multiple existential risks?
A Brief History of Observation of the HUB
"It is useless to attempt to reason a man out of a thing he was never reasoned into." -Jonathan Swift
But less brief than the Wikipedia article *ahem*.
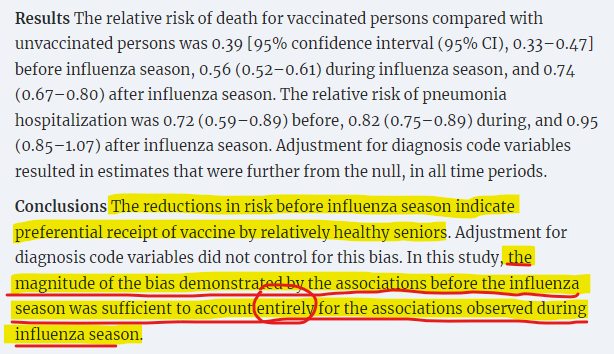
In a study on influenza vaccine effectiveness in seniors (Jackson et al, 2006), the HUB was found to account for the full totality of VE.
Contrast this with a similar study finding similar raw VE results (Nichol et al, 2007) that admonishes other research that, "may provide misleading pictures of long-term benefits, and residual confounding may have biased past results," without itself identifying HUB effects. The paper does report a sensitivity analysis on the aggregated data to show how a confounder might lower VE, but as a professional Biostatistician would tell you (none were on that paper), that necessarily runs afoul of something called the ecological fallacy as the VE for the disaggregated age bands were wildly different. The authors of this study do pat themselves on the back for working with long-term data sets.
Another paper that examined long-term data sets (Fireman et al, 2009) used seasonal analysis to estimate HUB in a different way than the Jackson team did, chopping seasonal intervals further into monthly intervals. They computed the long-term VE to be merely 4.6%, a number which could be a placebo effect, or even a data aggregation effect (uncorrected ecological bias).
A good paper that demonstrates observation and quantification of the HUB is a systematic review of influenza vaccine effectiveness (Remschmidt et al, 2015) from a few years ago.
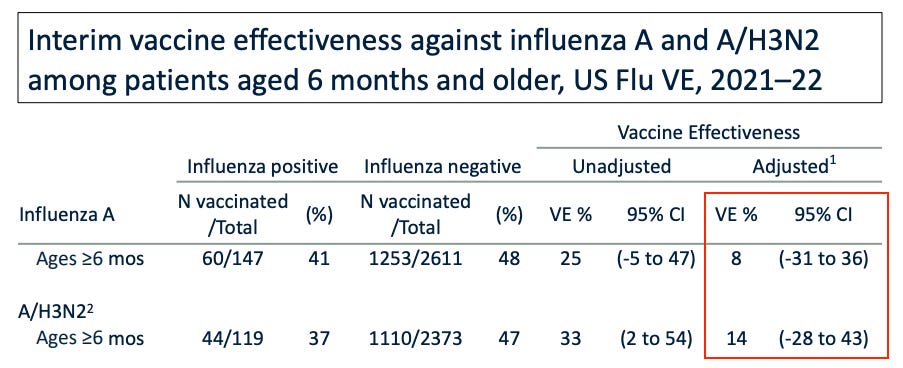
More recently, Toby Rogers notes CDC claims of only 8% to 14% VE for flu vaccines.
This carefully choreographed process results in failure more often than not. This is not a surprise — using a one-vaccine-fits-all approach to prevent a rapidly evolving virus that varies by region is unlikely to work. Lisa Grohskopf from the CDC’s Influenza Division reports that last year the flu shot was somewhere between 8% and 14% effective (based on data from seven sites that participate in the U.S. Flu Vaccine Effectiveness Network).
Toby then notes that the CDC-published study on students at the University of Michigan (Delahoy et al, 2021) found no effectiveness at all from the vaccines. Zero. Zilch.
ICAN has written to the FDA about these observations.
The HUB effect on influenza vaccination in particular is well known enough that a team of Canadian researchers (Eurich et al, 2017) suggested using influenza vaccination rates to correct for HUB in other studies.
Does that make sense?
It actually does—at least to some degree. While recent influenza vaccines may have zero effectiveness in stopping the flu, one study (Hosseini-Moghaddam, et al, 2022) finds flu vaccination associated with lower risk for COVID-19, which is exactly what we would expect of the health associated with influenza vaccine uptake generally conferred advantage in avoiding other respiratory and pneumonia-inducing illnesses:
This really doesn't look good for the vaccine pushers who are likely aware of every bit of data that I have showing HUB = VE, and plenty more. What looks even worse is a side-by-side comparison of annual flu vaccine doses and incidence of influenza mortality.
Oddly, despite the evidence that HUB (and other mild biases) fully explain the totality of VE computations, and apparent historical inability of influenza vaccination to reduce the burden of influenza mortality, the CDC declares influenza vaccines to be 40% to 60% effective. They make no mention of the HUB whatsoever, but lay out some flowery language about some black box method that "takes information into account in appropriate ways," perhaps for the sorts of people who trust timeshare brochures.
The CDC does provide several paragraphs suggesting that VE is variable for different influenza strains, which might be a great way to deflect the occasional study that fails to demonstrate effectiveness during any given season.
Sadly, but not surprisingly, there are plenty of employed researchers with the ability to see around the HUB to propose magical effects of vaccines, such as in curing completely unrelated diseases. In an amusing correspondence to The Lancet, researchers Salaheddin M. Mahmud and Christiaan H. Righolt reached out to gently reject one of these assertions.
Before we move on, I should point out that HUB is likely underestimated in literature due to skews in iatrogenic mortality. Those who are conscientious seek more medical care, and are therefore more likely to suffer from what is one of the leading causes of death (prior to the pandemic, some researchers suggested it is in the single leading cause of mortality).







The sickest and the most spiritually miserable people I know are those with Very good insurance coverage and above average incomes. They run to their doctor for the slightest hint of Not feeling well and follow the Doctors advice as though it comes from God. Instead of making a lifestyle change that would most likely solve their wellness issues.
Ellen, I’m not vaccinated and now not ever getting flu vaccine again. Stopped 2 years ago. Got covid, had sore throat, no cough, no fever, no aches. Went to local urgent care for sore throat thinking I had strep. Tested for covid, flu, strep. Positive for only covid. Took z-pack 5 days but recovered in 3. All that fear about covid is overblown. I’m 73 and did fine. With not taking covid jab, I don’t worry about sudd effects and vax injuries.