


Modeling Bounty for Sensitivity Analysis on Randomized Results
The Chloroquine Wars Part LXXXVI

"An approximate answer to the right problem is worth a good deal more than an exact answer to an approximate problem." -John Tukey
Edit: Three submissions have been received, and data quality is being checked. I am not taking more submissions at this time and hope to display some of the plots soon, with my own interpretations.
A few weeks ago, seeing that I was too busy to get everything accomplished that I would like, my wife downloaded data from the CDC and put together several charts showing almost no correlation at all between vaccine uptake and COVID-19 case rates among U.S. counties. For some reason, the dataset she downloaded did not included Texas, so this is sans Texas:


There are several more of these that tilt slightly up or down depending on age range or 1 vs. 2 doses, and cases vs. deaths. Not one of them makes a compelling case for vaccine efficacy. Neither does the international data, and it doesn't take a great deal of number sense to see that if you look at the data every day like I do. Just when I was beginning my own analysis of that data, two analysts published a paper demonstrating a lack of correlation between vaccination and case rates both in the U.S. and internationally (Subramanian and Kumar, 2021).

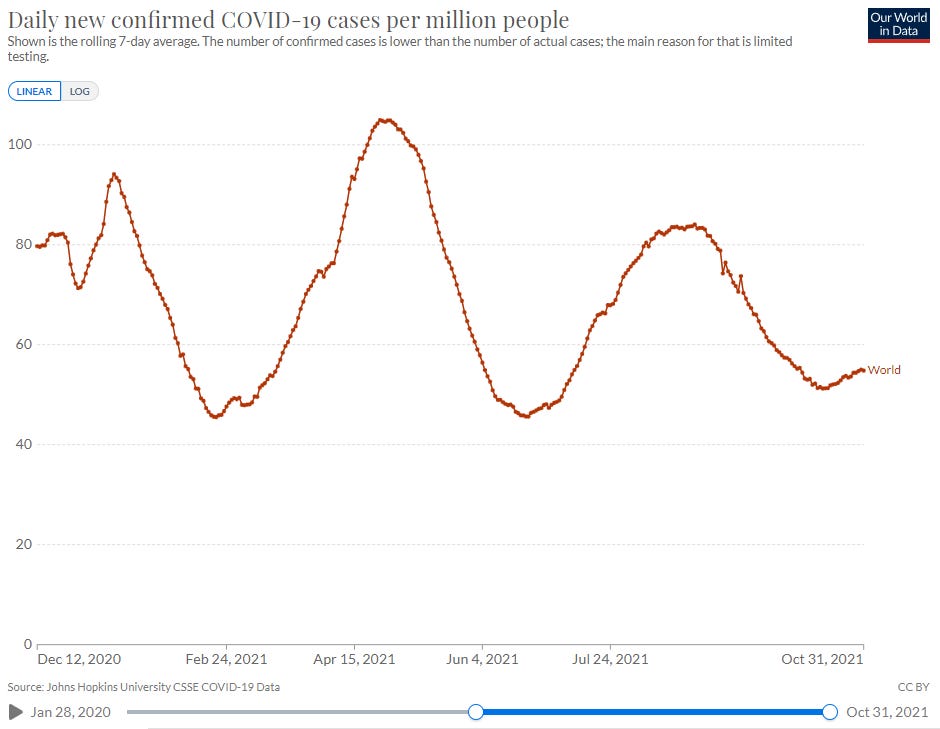
It certainly looks as though vaccination results in more cases of COVID-19. And at the point at which 7 billion vaccine doses have been administered worldwide, why does the global case trend look more like rolling waves than anything we might call "herd immunity", even in jest?
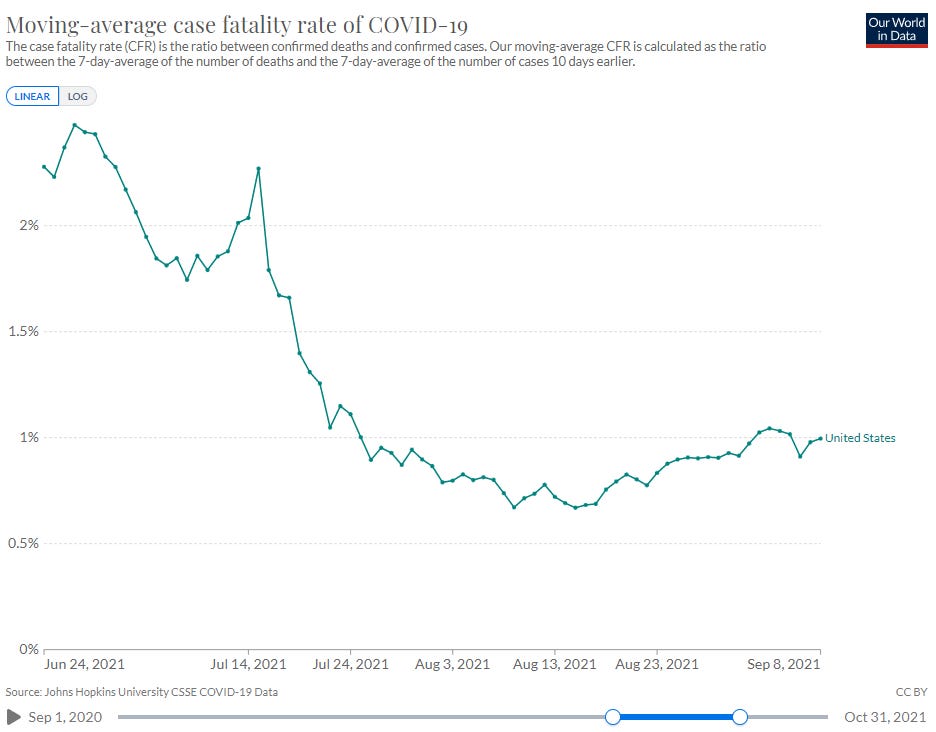
Fortunately, COVID-19 mortality has trended down a bit, but less so than we would expect given the substantially lower case fatality rate (CFR) of the delta variant. As the delta variant moved in to the alpha variant one nation at a time, CFR collapsed,
I went back to working on the international correlation analysis, and from several different angles, while putting together a system that will allow rapid re-analysis in the future. But I have another project in mind, and I'd love for some help from one of the RTE readers, several of whom have emailed me to offer their skills as a programmer or modeler.
The Project: Plotting Randomized Results Assuming Vaccine Efficacy
Take the counties of the U.S. and their populations and vaccination rates, and total infected per county over some time period like Aug-Sep-Oct, then randomly generate a scatter plot (or a few) several times as a modeled sensitivity analysis for each assumed efficacy rate:
(1) 95%
(2) 80%
(3) 60%
(4) 40%
(5) 20%
(6) 5%
I will happily pay $1,000 and a lifetime subscription to the RTE substack for the scatter plots (96 in total 4x each for cases/deaths, 1 dose/2 doses) and the code.
My belief is that the scatter plots for (1) through (3) and maybe (4) & (5) also will look so little like the real world data that it will be hard for vaccine partisans to refuse coming to the table for a serious discussion of the data.
Edit: The bounty will be paid after code checking, and with the presumption that the plots look well presented (we can work on that part on the back end of production to pretty them up, so that’s not a real worry). The code should be uploaded to github and made open source for others to add potential improvements (based on population density, using international data, etc.).
I love this idea of utilizing your readers! I can't wait to see what someone produces.
Hi Matthew,
I believe I have done this in essence, perhaps a bit simplistic, but in keeping with the article - "an approximate answer to the right question".
Due to time constraints I've ignored the extreme cases (0.05 and 0.95), but have done the others, and the extreme cases are clearly not necessary as the actuals are closer to the other cases.
Obviously there may be confounding factors, but the conclusions seem straightforward - I won't spell them out for you.
I haven't exported 4 simulations for each scenario, as they all look very similar, but that's easy to do if you want to just run the code multiple times.
As requested, I've uploaded the code, data and images to github for you to review:
https://github.com/DrMikeJS/RandomizedVaccineEfficacy .
To run the code you'll need to download and extract the data, and then point the first few lines of the script "RVER.R" to the extracted files.
This is a best case scenario for the vaccines in that I've based the simulated distributions off the actual distribution. If they were fully randomized, they would look even more different.
I note that there are a few hundred counties where it appears that there are 0% vaccinated. If that is accurate (I haven't attempted to verify the integrity of the data), then we could use that as a control group (in a separate exercise), and I suspect things would look even less favorable for the vaccines.
Anyway, best regards and keep up the good work!
Michael