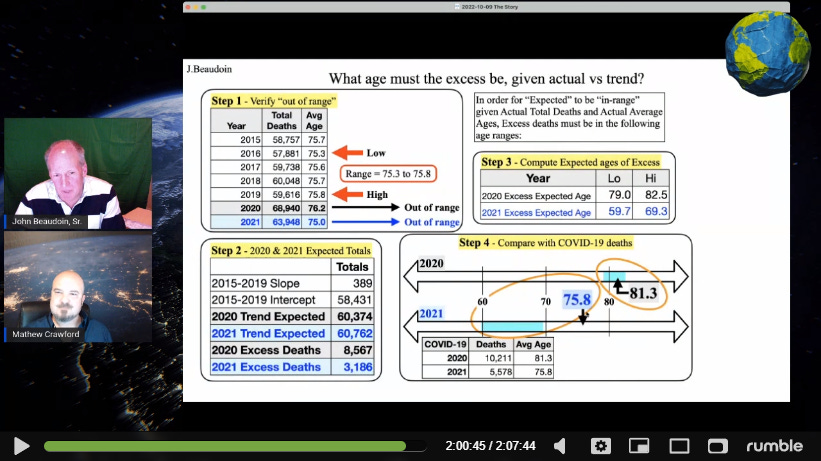
John Beaudoin is one of the unsung heroes of the pandemic. Through a record request and a lawsuit, he obtained all the data from Massachusetts necessary to look under the hood and see clearly that the pandemic in 2020 and the pandemic in 2021-2022 look like two entirely different events. And the evidence points clearly toward the introduction of COVID-19 vaccination as the offending variable.
John joined me for a two hour conversation and walked through the data, including a database he personally created from the full set of Massachusetts death certificates.

We chose not to stream to YouTube and do not plan to upload this content there because we go way over any line we might expect for the Tech Overlords to allow us.
Here is one of John's early articles interpreting the data.
Joel Smalley also wrote up an excellent analysis of John's data. I've featured it once before, but here it is for those who might not have seen it or want to revisit it now.
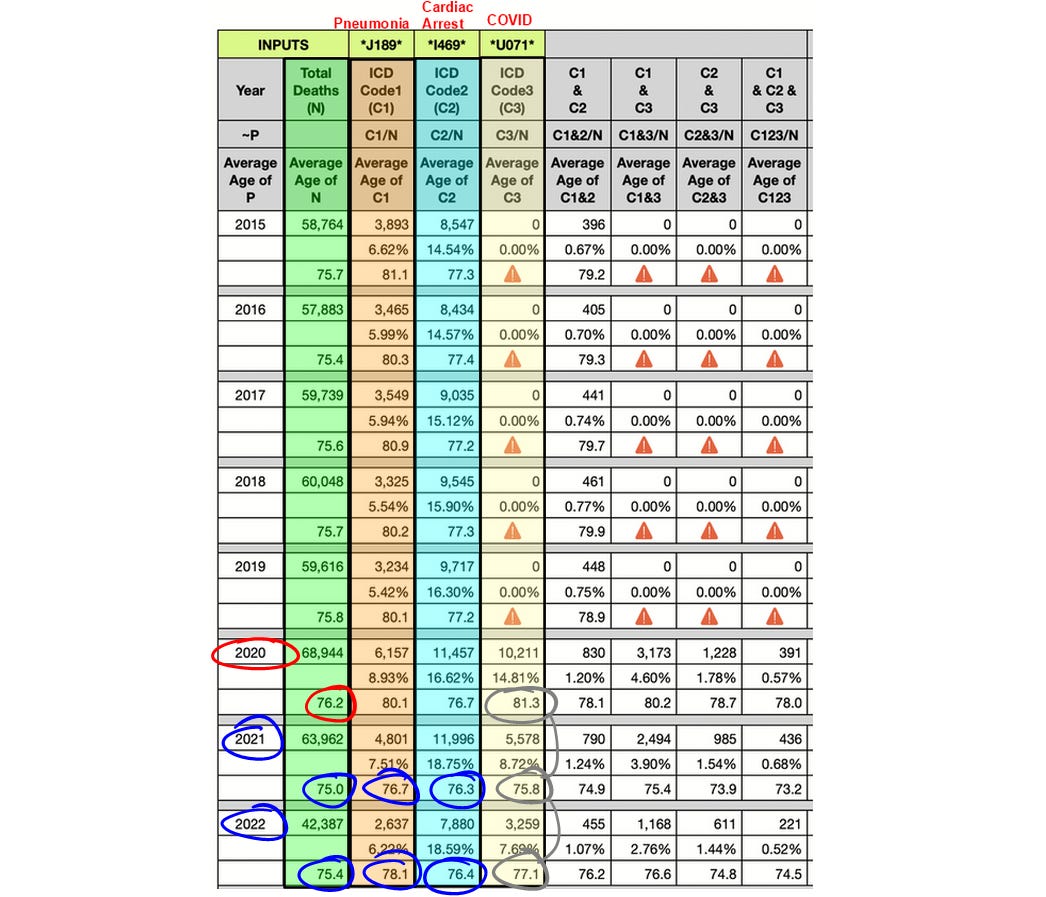
John sent me one last data grab that I took the liberty of marking up a bit:
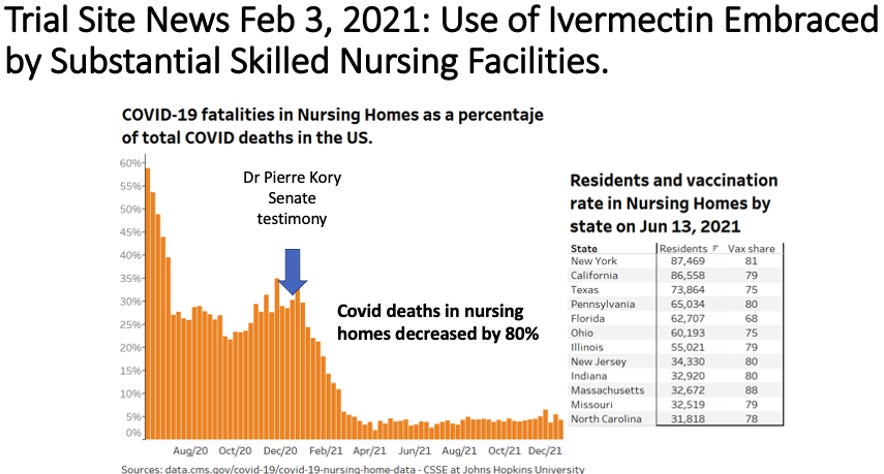
I gave names for his ICD-10 codes, then circled high outliers in red and low outliers in blue for 2020-2022. The averages ages for COVID-19 are all circled in gray because there isn't a history to go on. But we see the average age for COVID-19 deaths change dramatically from before to after vaccination began. It reminded me once again of Dr. Pierre Kory's chart showing the proportion of nursing home patients among COVID-19 deaths collapsing just after the vaccination program began.
Proponents of the vaccine will suggest that the vaccines stopped the elderly from dying, but they can't explain why the young started dying. On the other hand, if 2020 was a year of procedural iatrogenocide, ventilating patients for the crime of testing PCR positive while denying most of them antibiotics and enough water to stay ordinarily hydrated, then the deaths of younger people—not to mention the substantial shift in symptomatic causes of deaths—is much likely explained by the vaccines than a shift in viral behavior.
Assuming I don't get swamped with a higher priority, I'll come back with a Part 2 soon and break down some of John's slides for whatever clarity I might be able to add, including mixed with other data sources I can pull together.


Thanks much for having me last night.
Regarding that new table of codes in combination, I didn't send the right portion because it's still messy and difficult to name. But the data in the table you have can show the following:
Also having Cardiac arrest I46.9 as a percentage of all pneumonia J18.9
2020 - 13.5%
2021 - 16.5%
2022 - 17.3%
Also having Covid U07.1 as a percentage of all pneumonia J18.9
2020 - 51.5%
2021 - 51.9%
2022 - 44.3%
Also having Covid U07.1 as a percentage of all cardiac arrest I46.9
2020 - 12.0%
2021 - 17.7%
2022 - 18.7%
I'll leave it up to others to look at how the years are different and the causes match or don't match. You could spend the rest of your life speculating how this happens. Fraud, behavior of medical examiners, laziness, introduction of a strong variable like vexine or Remdeathivir, or act of God. But it is interesting to look at the combinations and how they change.
WARNING: None of these new numbers have been triple checked for cell math yet. But you can do the math by the cells given.
Thank you again, Mathew. Very gracious of you to host. I know one thing for sure. The people on team reality are gracious, virtuous, and righteous as opposed to the other side, who depend on pride, wrath, and lust for power. They censor and scold, coerce, and solicit. All we do is present facts, which are truths and truth. We will win.
Post a youtube 'teaser' with a link to the Rumble full vid and an explanation that the full vid would be censored by YT.
Standard practice now.