Proof of Statistical Sieves in Vaccine Efficacy Data
The Vaccine Wars Part XXXI
There is a great deal of evidence that the retrospective studies, and the accompanying surveillance data that the public has been allowed to view, are highly suspect in nature.
On February 22, the New York Times published an open admission by the CDC that they've "withheld critical data on boosters, hospitalization and, until recently, wastewater analyses." This shocks none of us who have kept up with even a fraction of the data during the pandemic. Still, there are some people who refuse to believe in even the need for due diligence with respect to some authorities. This article is primarily for them. I hope some will read it, and at least see the need to dig a little deeper.
Do COVID-19 Vaccines Prevent Car Accidents, Murder, or Suicide?
Is that a weird question?
The reason that I ask is that I happen upon this report (Wu et al, 2021) at the CDC stating that those who received COVID-19 were dying less often outside of COVID-19 related illness.
How wonderful! That genetic material designed to elicit an antibody response targeting SARS-CoV-2 maybe prevents heart disease or Alzheimer's or cancer?
It looks like part of the spike protein may suppress the P53 protein (Singh and Singh 2020), which is the keystone of the P53 pathway feedback loop of cancer suppression. Using that same spike protein to prevent cancer…seems about as likely as experimental injectable products preventing iatrogenic disease. But let's dig deeper.
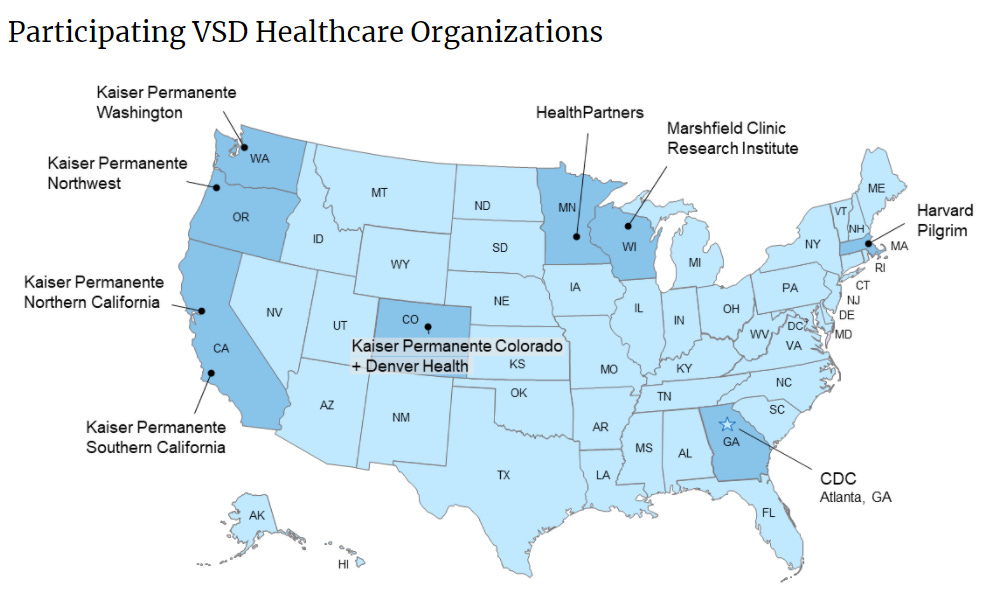
The CDC report in question compiles data from the Vaccine Safety Datalink, which is a consortium of health providers in several states, almost half of which are Kaiser Permanente.
Like DMED, the VSD is part of the Vaccine Safety Technical (VaST) work group.
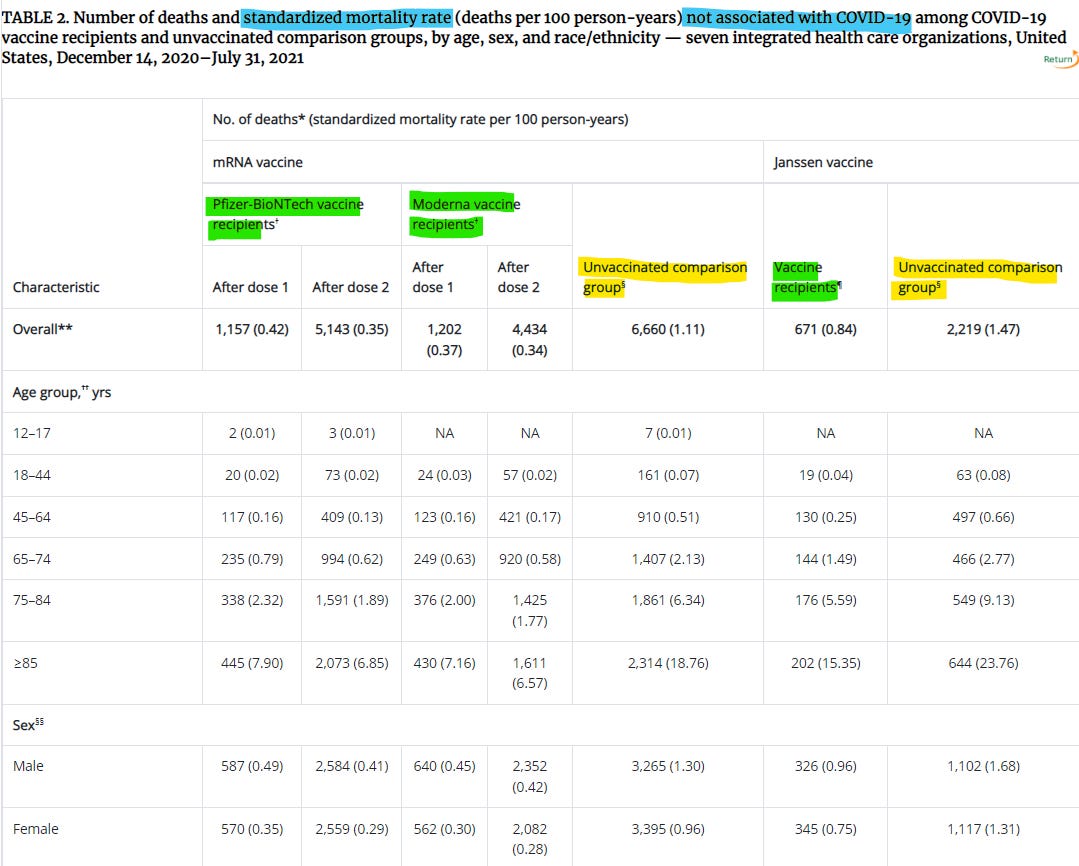
Here is an interesting table from that October VSD report. I cut off the bottom of the table with racial demographics for simplicity:
Remember: these are deaths that are not in any way associated with COVID-19. Now, focus on the numbers between the parentheses. These are the normalized rates of death per 100 human years. There is a lot here that looks whacky.
First, note that there are two unvaccinated groups used for comparison against the different types of quasi-vaccines. I get why they're doing this (sort of) to separate out populations to reduce some forms of bias, but it starts to give the game away before we even get started. The idea that these biases would be consistently around 30% in the same direction for every demographic slice is highly suggestive that something is mucking up the numbers. This looks like the result of some form of statistical sieve.
Second, all of the rates of death for the Janssen vaccines are substantially higher than for the mRNA vaccine recipients—and the unvaccinated comparison group has higher mortality. And this difference isn't small. I'd ask if there are parts of the country where every age group dies 40% or 50% more than others, but I spent enough time doing actuarial work that I know that the answer is definitely no.
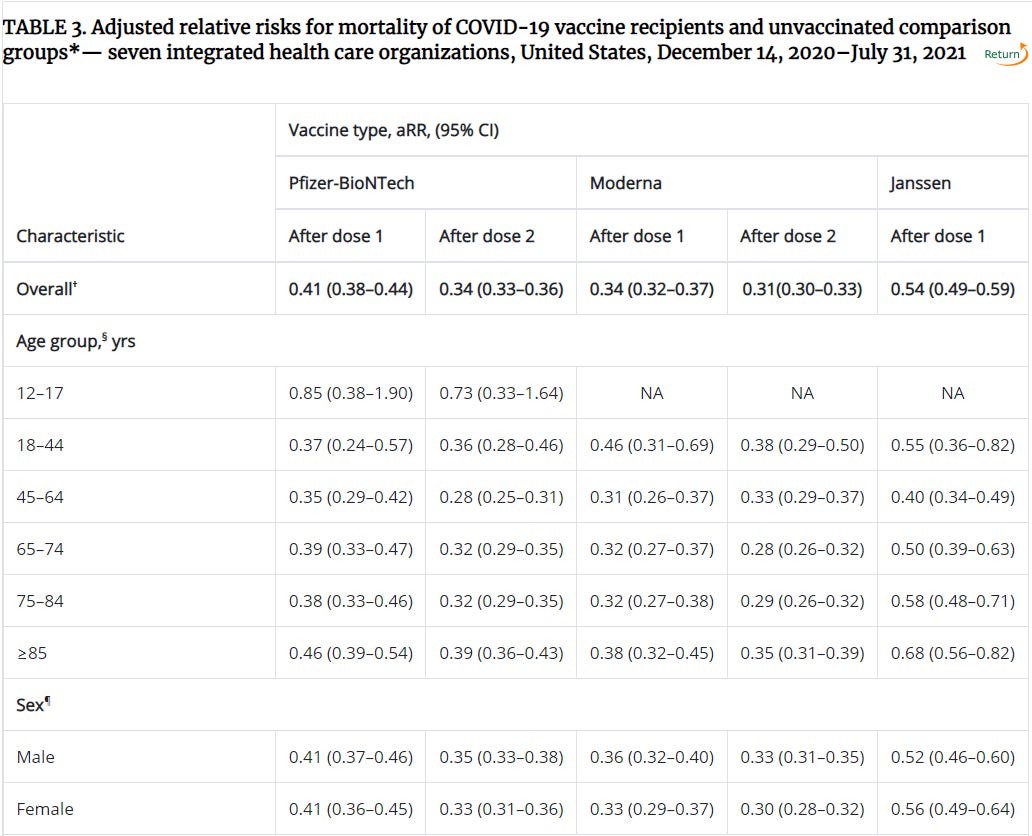
There is clearly something wrong with these statistics, but we haven't even gotten to the best part. The next table shows relative risks within each age group.
Note that for most demographics, the mRNA vaccines appear to be 60-70% effective at preventing non-COVID related mortality.
Huzzah! This is the most amazing thing to ever happen to humanity. Let's ramp up production and jab everybody every day! We're going to live forever!
I hate to ruin the party, but this doesn't jibe with the all-cause mortality data. But feel free to stand in line for daily injections. We'll check in with you. I promise.
Out of curiosity, I did a little research on causes of death while imagining which forms could plausibly (plausibly??) decrease in frequency in people who get pumped up with mRNA and lipid nanoparticles. Unfortunately, the CDC data on causes of death have mismatched age ranges (these are maddeningly nonstandard). But I found some smaller age ranges that allowed me to piece together a fairly accurate picture of causes of death for those 18-44. In particular, the three most common causes of death among young adults in America are (1) accidents (mostly car accidents), (2) suicide, and (3) homicide. I'll call this the "physical death trio" or PDT. In fact, for the 20 to 24 age group, these comprise 78% of all mortality. Using this data slice and making a modest estimate as to how to divide up and portion out a demographic, I came up with right around 50% PDT deaths in the 18-44 age range.
Now, focus in on that age range in the chart above.
If vaccines can reduce non-COVID mortality by as much as 64% in this age range, that means at least 14% of that 64% (absolute) numbers comes from the PDT numbers. That's 14% out of 50% or 28% of all PDT deaths—at a minimum!
The Proof of Illusion
Now, permit me one tiny axiomatic assumption with respect to the experimental injectable products reported on in the VSD: they don't save you from bullets, improve your drunk driving, or fix your life. Therefore, the VSD numbers are impossible. Thus, the VSD numbers prove the presence of a statistical sieve. QED
The seive could be a matter of counting people who are vaccinated as unvaccinated during 14-day and 21-day windows (but only in the numerators where deaths occur, not in the denominators where person-years add up), or it could be the statistical illusion that results from a simple delay in death reports, as amply demonstrated by Professor Norman Fenton. It might be some other sieve, but the point is clear: the statistical methodology used by the CDC has clear and obvious uncorrected bias. Taking the "waning efficacy" story (also probably nonsense) into account, this statistical sieve seems to represent most or all of the entire claimed efficacy total. If there is any effect size left, it might simply be survivorship bias.
Addendum:
Traffic fatalities increased during the first nine months of 2021 with respect to 2020.
2021 saw the highest increase in the homocide rate in modern history in the U.S.
2021 suicide rates were part of the massive uptick in Indiana insurance data in the 18-44 age range. They also went up in the DMED data, which I’ll talk about another time.


Looking at various pro-vaccine studies, it was obvious to me that the raw data "pea" was being hidden under the adjusted data "shell."
Raw data isn't being reported.
Bias in the adjusted data is what would be called "systematic error" in chemistry and physics.
Systematic error should be caught and prevented with proper procedure. Systematic error should never make it into the reported data.
The age range choices for the CDC datasets have confounded many analyses I've attempted to conduct, mostly revolving around age-adjusted CFR's & IFR's.
It's doubly frustrating because the CDC obviously HAS the data, and chooses not to provide it to the public in a form that we can verify their work with