

A Mechanistic Explanation of the Vaccine Efficacy Illusion
A Mechanistic Explanation of the Vaccine Efficacy Illusion
The Vaccine Wars Part XLII

About a week ago I published a first "Who Died During the Plandemonium?" Article. I plan a sequel, but the first one spurred a ton of good discussion. Some of that took place at the first RTE Clubhouse Chat (again at 8:30 PM Eastern each Monday). I thought that first conversation was great. Not long after that conversation, I saw Ethical Skeptical on Twitter making a similar point to one that we discussed, but in a different way that is quite illuminating:


Where possible, it is best to understand the statistical attributes of a thing from as many revealing angles as possible, with economically reasonable attempts to study biases. This is part of the process of building expert intuition. Sometimes, as in this case, a new perspective is valuable because it tells a story that most of us (who are honest, I would think) see good reason to relate to the causal level of judgment.
Important: Judgment of causation never rises above opinion in science and inferential statistics, but the more we study (anything) phenomena—and most particularly if we test them and make "bets" over them—the better sense we get of which images are most valuable for that judgment. People who study science and statistics more learn a few hundred…let's call them "jujitsu positions" in science and data that "beat us" (fool us or lead us honestly astray) until we learn how to handle them.
ES wins a grappling match by clean submission by showing that (still working at the U.S. county level) COVID deaths correlate to vaccination no more and no less after vaccination began as before. The pattern of results just…remains the same. This supports both,
Crawford's Zero Efficacy Hypothesis, and
My belief that the apparent mild efficacy is due to wealth and education biases.
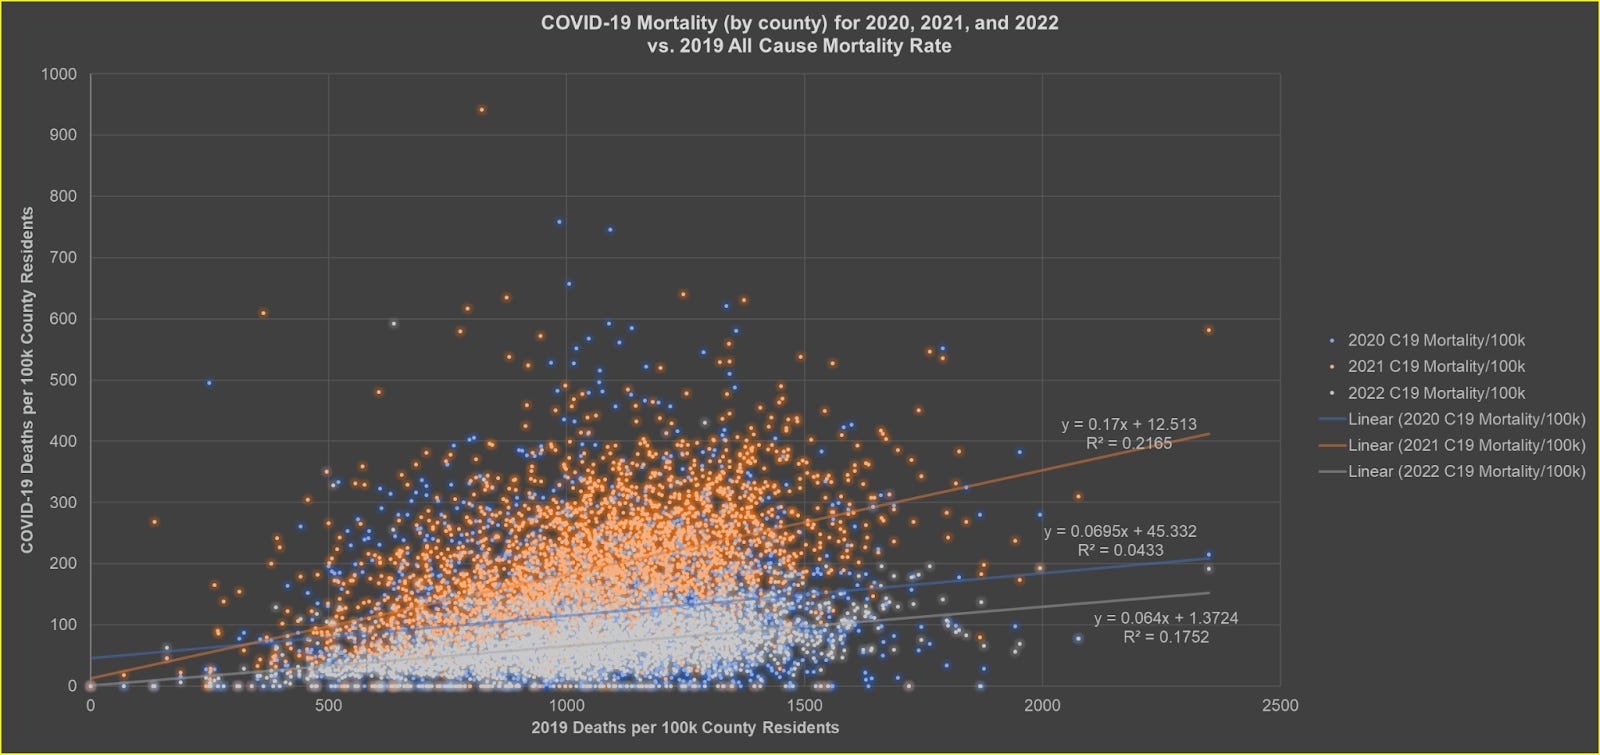
Let's take a look back at one of my last charts from last week's article:

I was focused more on income/wealth/education and its impact on health, but had also noted that these variables factor into "prior mortality rates" (such as with 2019). I made a few more charts. The first one is a scatter plot of 2020/2021/2022 C19 deaths by county each plotted against 2019 mortality rates. What we see is an extremely high YoYoY relationship with 2021 standing out as higher in C19 mortality magnitude for most counties.
I talked with a smart friend about whether or not Big Pharma might be crafty enough to have known about the income/health relationship that would result in the artificial appearance of efficacy, and whether or not they might have helped sculpt policy that would result in the illusion of efficacy. He doesn't think they're that smart. I think they've had years worth of data to detect various Simpson's paradoxes, and then put them to use. At the very least, it's worth thinking about.
I decided to make one more scatter plot comparing median household income by county to many different variables. Forgive the incomplete legend. All rates per 100k.
The Red/Orange/Yellow are various vaccination rates. See how parallel the three trend lines are! This suggests essentially a lockstep relationship between vaccination rate and median household income.
The Green represents the 2019 all cause mortality rate for each county. I scaled those dots by (0.15) in order to better compare the various COVID-19 death trends.
The Light/Dark Blue and Purple are the 2020, 2021, and 2022 (scaled to annual) COVID-19 death rates per county.
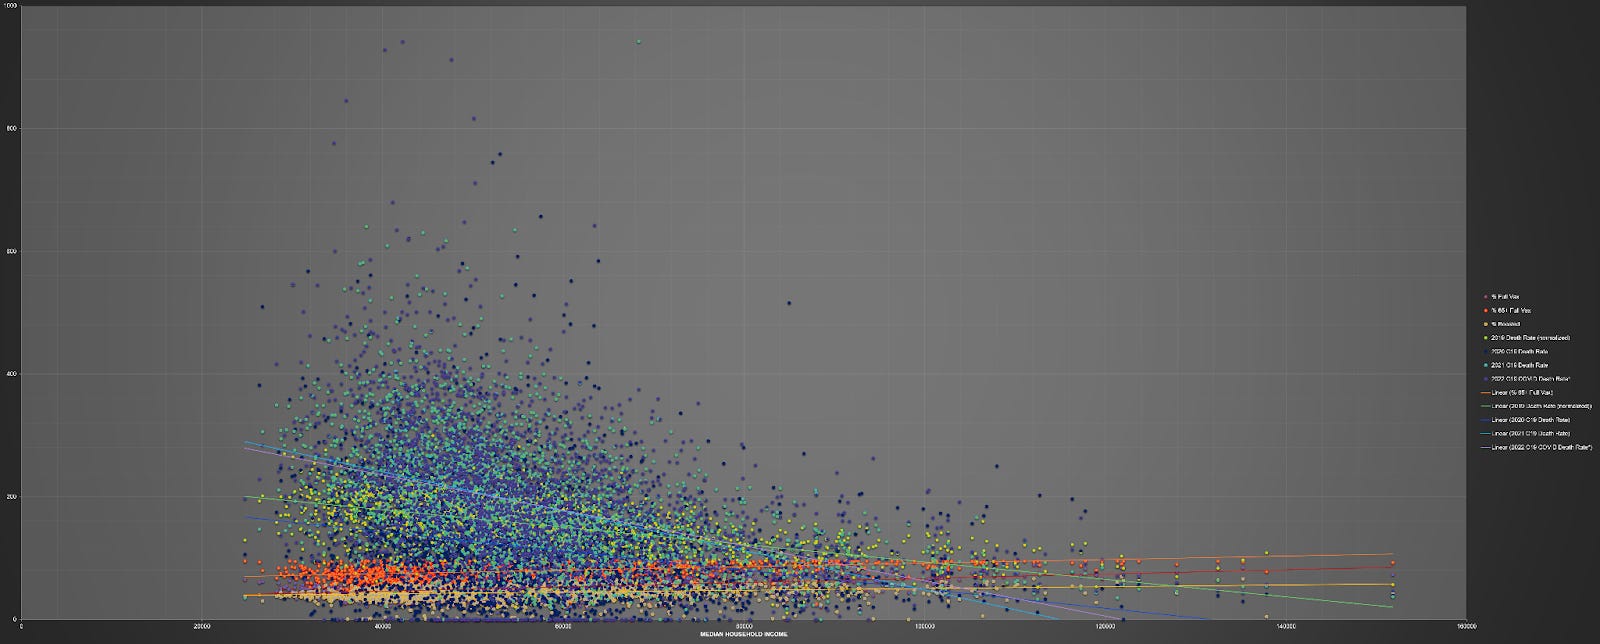
We see that COVID-19 kills less in wealthy counties, and that protective effect of wealth becomes amplified during the year of the experimental vaccine rollout.
Though I had a couple of items mislabeled on my original chart, Clare Craig got it.


Somebody responded by looking to see where county C19 deaths are better predicted by vaccination or income. It turns out that there are plenty of each. It's a close call.


And again, this is what you would expect if there were zero true vaccine efficacy, and that all signals of efficacy were simply signals that wealth allows the purchase of health.
Once we identify household income as a confounder, we begin to see the same mistake in other places, too. I suspect that we will see it everywhere. Once you see it, you can't unsee it.

Clubhouse Recordings
I am planning to take one step a week in terms of recording myself while in Clubhouse and sharing visuals in a recording that will then be posted as a weekly video to YouTube and Rumble (to start with). I'd like to see if I can turn that time into something highly educational.
Babies are significantly less likely to be born to mums who've been vaccinated.
“ I talked with a smart friend about whether or not Big Pharma might be crafty enough to have known about the income/health relationship that would result in the artificial appearance of efficacy, and whether or not they might have helped sculpt policy that would result in the illusion of efficacy. He doesn't think they're that smart.I think they’ve had years worth of data to detect various Simpson's paradoxes, and then put them to use. At the very least, it's worth thinking about.”
The data scraping is now on steroids as billions of pcr dna samples have been taken this past 2 years. Any lab tweaked pathogens can now be customised to unprecedented levels and the soon to be released ‘tests for’ said pathogens provide an almost instant feedback loop. It’s the perfect planet lab rat scenario.